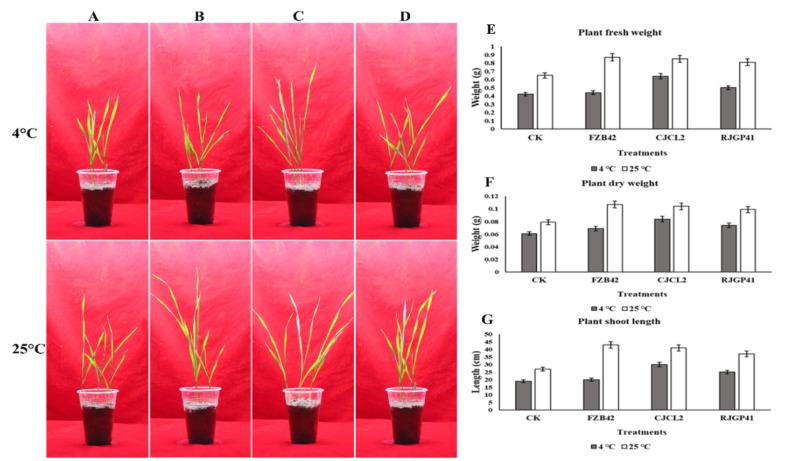
Figure 11.
Un-inoculated wheat plants grown at optimum temperature and under cold stress (A) Wheat plants inoculated with Bacillus sp. FZB42 (B) Wheat plants inoculated with Bacillus sp. CJCL2 (C) Wheat plants inoculated with Bacillus sp. RJGP41 (D) Fresh weight of wheat plants grown under cold stress and at regular temperature with different bacterial treatments (E) Dry weight of wheat plants (F) Total length of wheat shoots grown under cold stress and at regular temperature with different bacterial treatments (G). The error bars on the graphs indicate the standard deviation of the mean (n = 3). The significant difference between the treatments was observed by using Tukey’s HSD test at p ≤ 0.05 and the experiment was repeated three times.

