Figure 2.
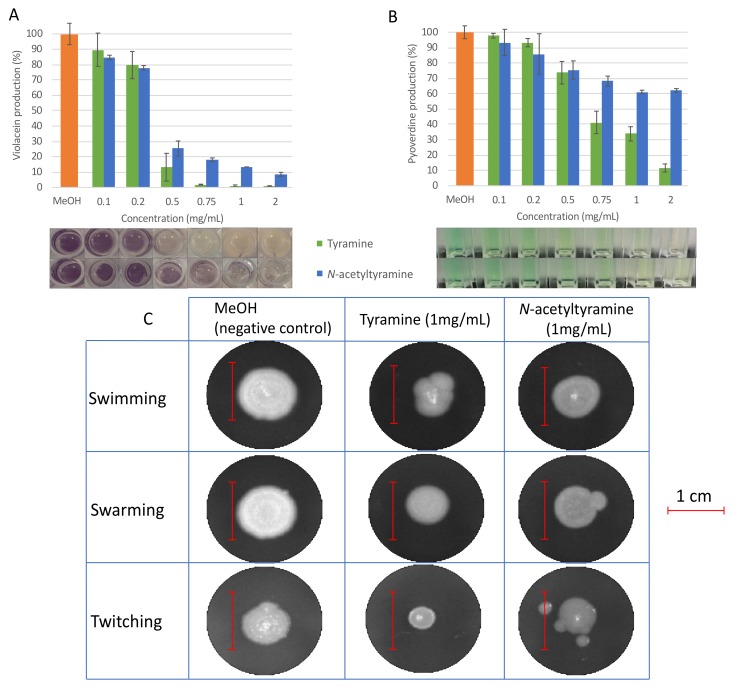
QSI activity of tyramine and N-acetyltyramine. Effect of tyramine (green bars) and N-acetyltyramine (blue bars) on violacein production in C. violaceum ATCC 12472 (A); effect of tyramine (green bars) and N-acetyltyramine (blue bars) on pyoverdine production (B) and on swimming, swarming, and twitching motilities (C) in P. aeruginosa PAO1. Values are presented as mean ± SD, n = 3. The scale bar represents one centimeter. The percentage of reduction was calculated based on the area of expansion that was obtained analyzing the image with ImageJ.

