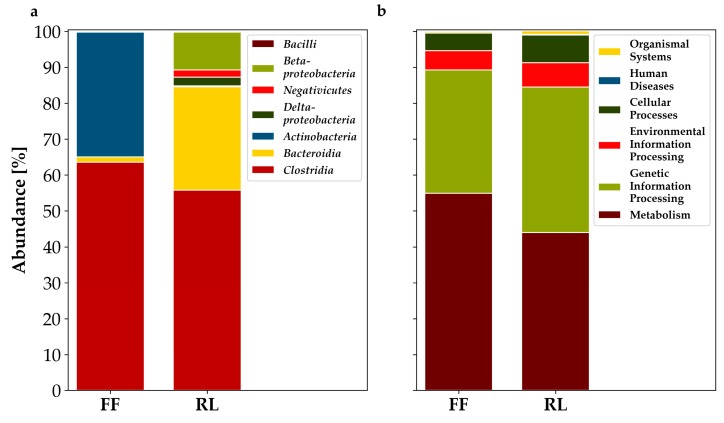
Figure 2.
Analysis of proteins significantly different in abundance. (a): Proportions of taxonomy of proteins at class level; (b): Functional analysis of proteins which were mappable to the KEGG Orthology database and that had a functional annotation assigned. Contains only protein identifications that occurred in at least two of three replicates (normalized NSAFs, significance testing: Fold change ≥ 1.5, t-test, Benjamini–Hochberg-corrected, p < 0.05) and that could be annotated. FF: flash frozen; RL: RNAlater-treated.

