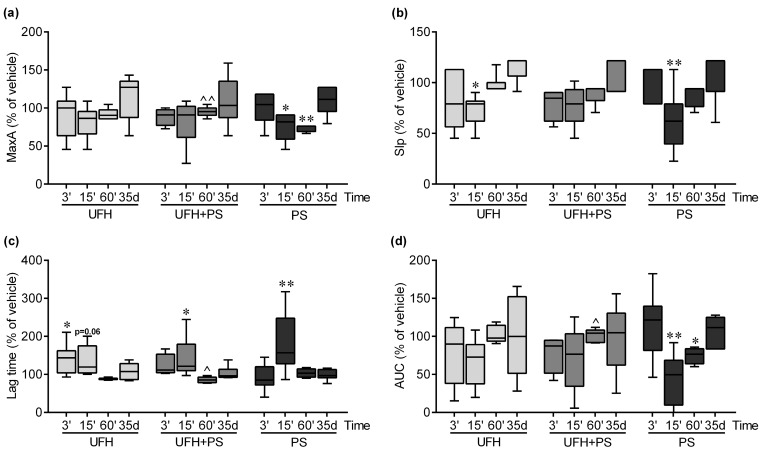
Figure 2.
Platelet aggregation results in mice at 3, 15, and 60 minutes (n = 4–7), and on the 35th day (n = 5–7) after unfractionated heparin (UFH) and protamine sulfate (PS) administration. (a) Collagen-induced platelet aggregation expressed as the maximal extension (MaxA), (b) the slope of platelet aggregation (Slp), (c) lag time, and (d) the area under the curve (AUC). The results are expressed as a percentage of the control samples, and are shown as the median (line) with the interquartile range (box), and maximum and minimum values (whiskers). The control values at 3 and 15 minutes were 11.0 (10.0–13.0), 9.0 (6.0–10.0), 115.0 (104.0–174.0), and 31.3 (21.1–40.4); at 60 minutes they were 10.5 (10.0–11.0), 4.0 (4.0–5.0), 137.0 (112.0–151.0), and 25.5 (21.4–30.6); and on the 35th day, they were 6.0 (4.0–8.0), 3.0 (3.0–4.0), 190.0 (150.0–270.0), and 11.6 (3.8–15.7), for MaxA, Slp, lag time, and AUC, respectively. * p < 0.05; ** p < 0.01 vs. vehicle; ^ p < 0.05; ^^ p < 0.01 vs. PS group; Kruskal–Wallis ANOVA with Dunn’s post-hoc test.

