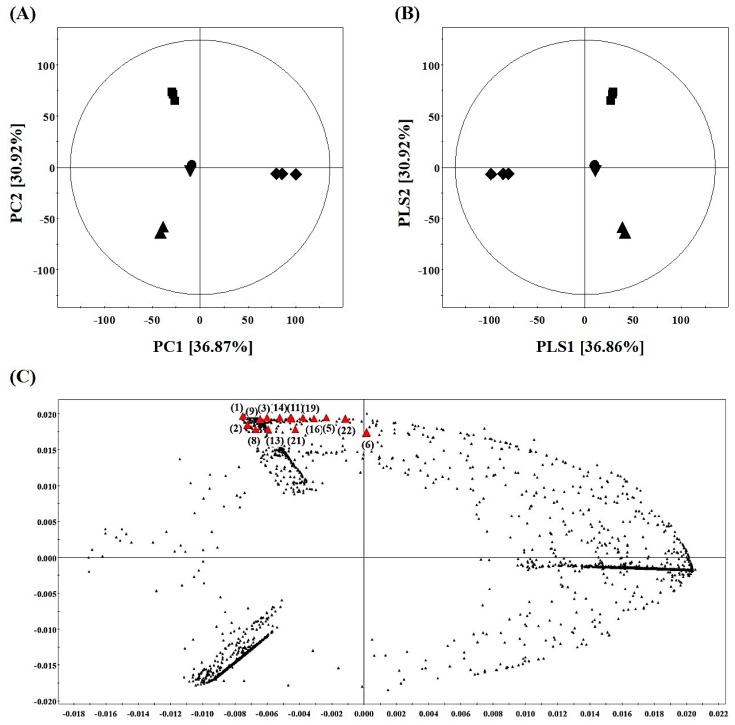
Figure 4.
Multivariate analyses of the five SPE MeOH extracts of AFEE. (A) PCA score plot (R2X (0.812) and Q2 (0.698)) derived from the negative mode dataset of UHPLC-LTQ-IT-MS/MS. (B) PLS-DA score plot (R2X (0.825), R2Y (0.995), and Q2 (0.981)) derived from the negative mode dataset of UHPLC-LTQ-IT-MS/MS. Extracted by ● 20% MeOH, ■ 40% MeOH, ♦ 60% MeOH, ▲ 80% MeOH, and ▼ 100% MeOH. (C) The discriminant metabolites (red triangle) for 40% MeOH E are indicated in the loading plot, which were derived from the PLS-DA results. The numbers shown in the loading plot are as per Table 1.

