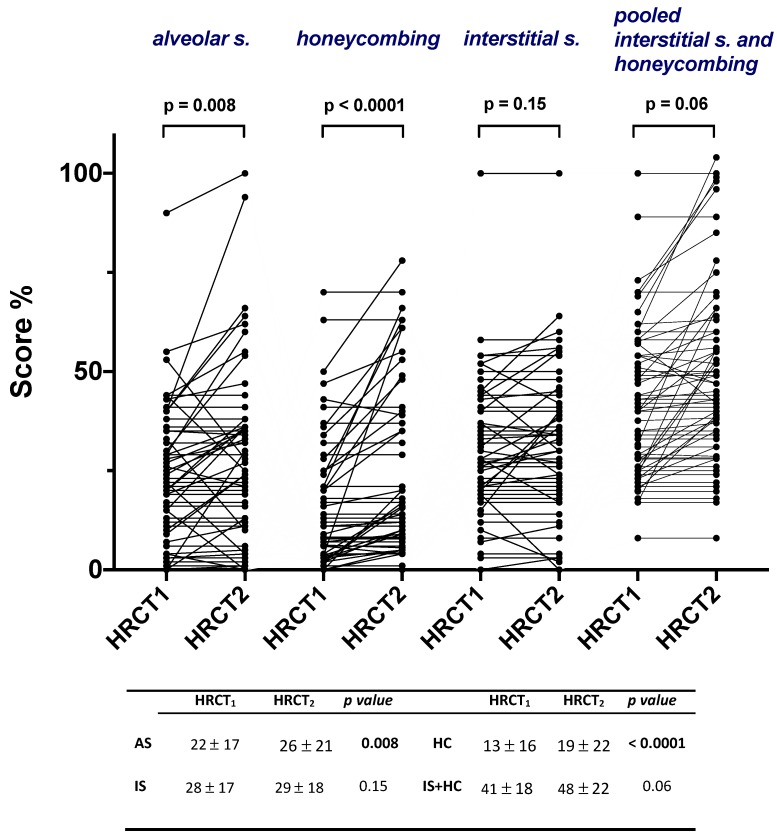
Figure 2.
Alveolar score, interstitial score, honeycombing and pooled interstitial score and honeycombing at treatment initiation (HRCT1) and after one year of treatment (HRCT2) in the entire study population. Values in the table below are expressed as mean and standard deviations. P values refer to comparisons between HRCT1 and HRCT2.

