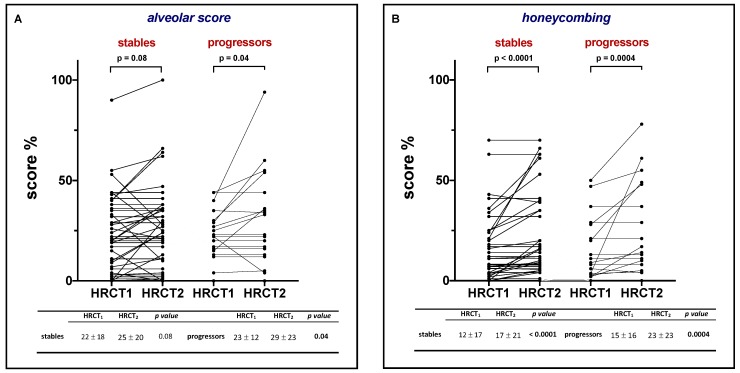
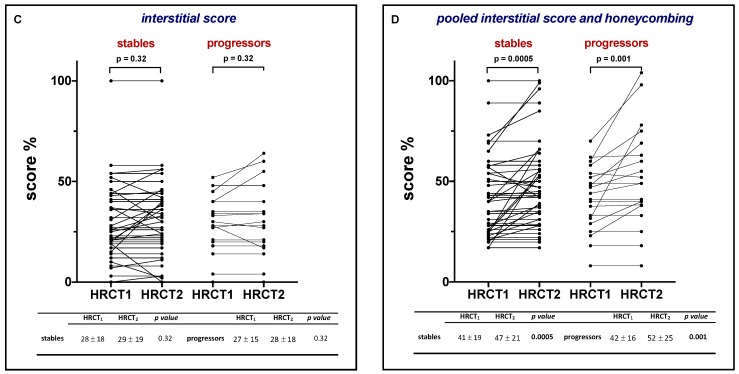
Figure 3.
Change in alveolar score, honeycombing, interstitial score and pooled interstitial score and honeycombing between HRCT1 (at treatment initiation) and HRCT2 (after one year of treatment) in stable patients (n = 48) and progressors (n = 20). Values in the table below are expressed as mean and standard deviations. P values refer to comparisons between HRCT1 and HRCT2.


