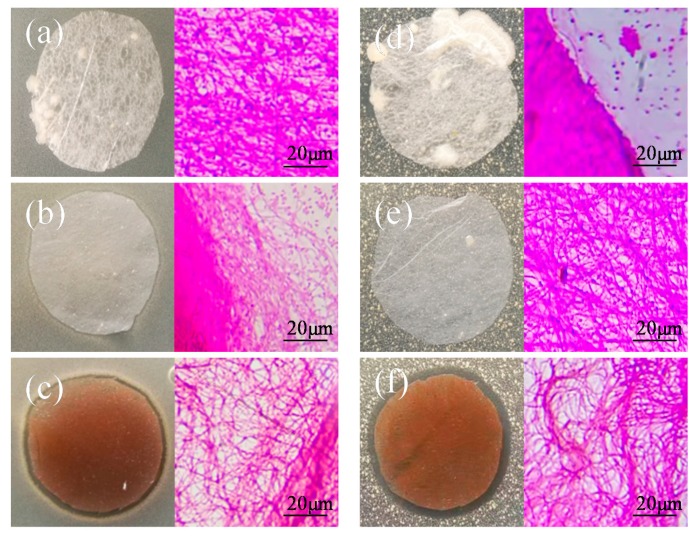
Figure 6.
Schematic diagrams of the antibacterial activity of composite nanofibers: (a–c) E. coli and (d–f) S. aureus. Figure 6a,d, Figure 6b,e, and Figure 6c,f represent Ker.30%/PA6, Ag.1%-Ker.30%/PA6, and Ag.10%-Ker.30%/PA6, respectively. The right-hand images of Figure 6a–f correspond to optical microscopic images.

