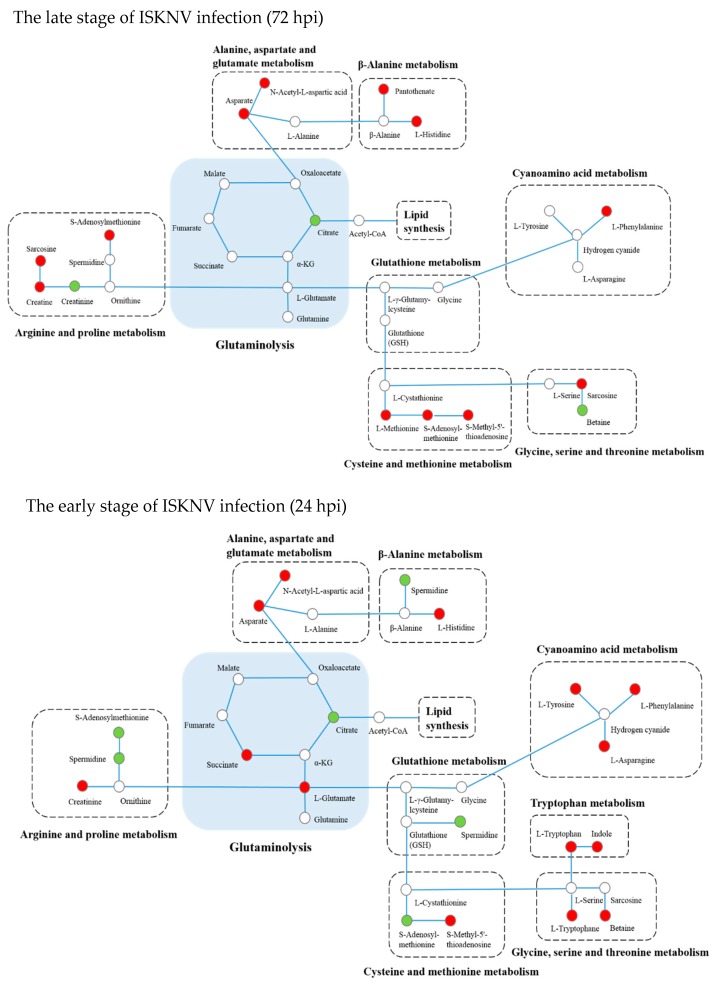
Figure 6.
Integrated networks of ISKNV infection outlining biochemical pathways related to amino acid metabolism. Metabolites are represented by circles. Changes in the levels of metabolites (circles) relative to control groups are color-coded to represent up-regulation (red) or down-regulation (green). Colorless boxes indicate that no difference was detected. Metabolomics data were collected from six parallel samples of CPB cells using UHPLC-Q-TOF/MS.

