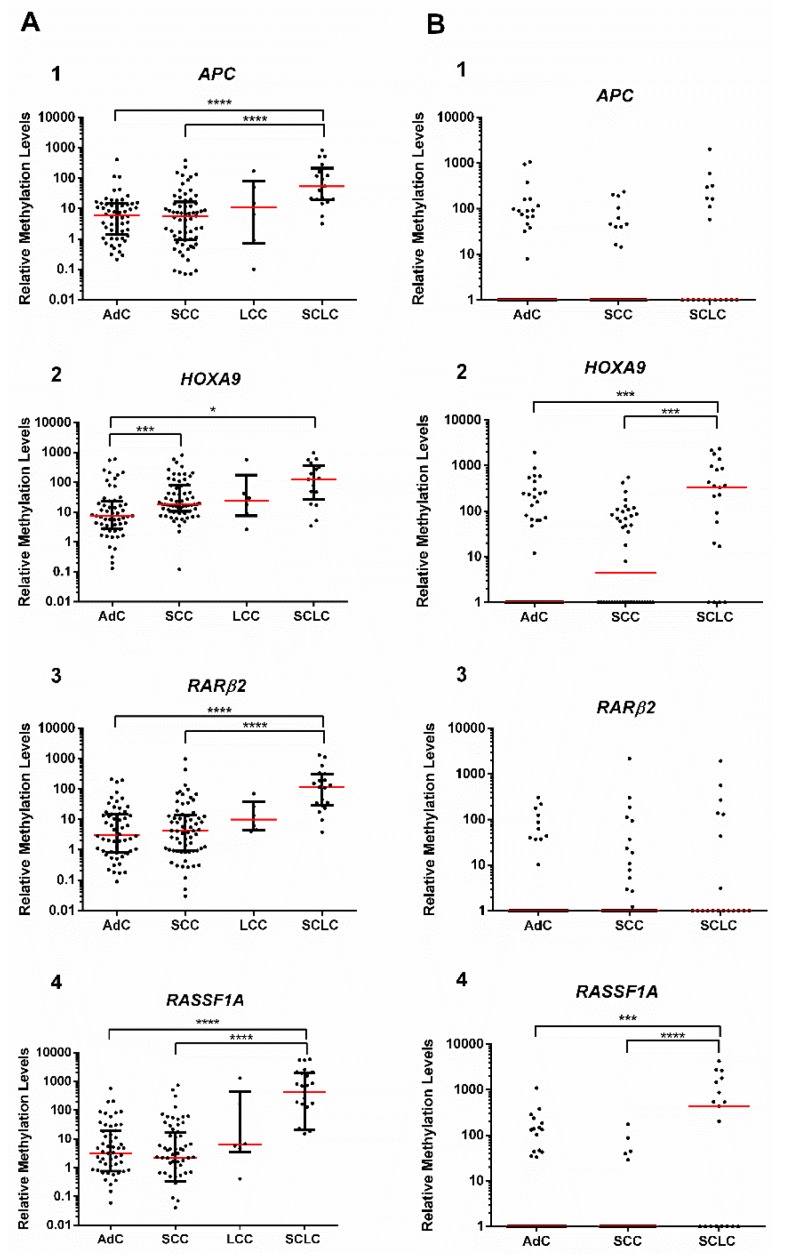
Figure 3.
Scatter plot of (A) (1) APC, (2) HOXA9, (3) RARβ2, and (4) RASSF1A methylation level distributions among lung cancer (LCa) histological subtypes (adenocarcinoma (AdC), squamous cell carcinoma (SCC), large cell carcinoma (LCC), and small-cell lung cancer (SCLC)) in study group #1 (tissue samples) and (B) (1) APC (number of values that fall in the x axis: AdC = 48, SCC =31, SCLC = 11), (2) HOXA9 (number of values that fall in the x axis: AdC = 44, SCC = 21, SCLC = 3), (3) RARβ2 (number of values that fall in the x axis: AdC = 54, SCC = 27, SCLC = 12), and (4) RASSF1A (number of values that fall in the x axis: AdC = 50, SCC =37, SCLC = 8) methylation level distributions among LCa histological subtypes (AdC, SCC, and SCLC) in study group #2 (plasma samples). Kruskal–Wallis test, followed by pairwise comparison though Mann–Whitney U and Bonferroni’s correction. *p < 0.05, **p < 0.01, ***p < 0.001, and ****p < 0.0001. Red horizontal line represents the median methylation level.

