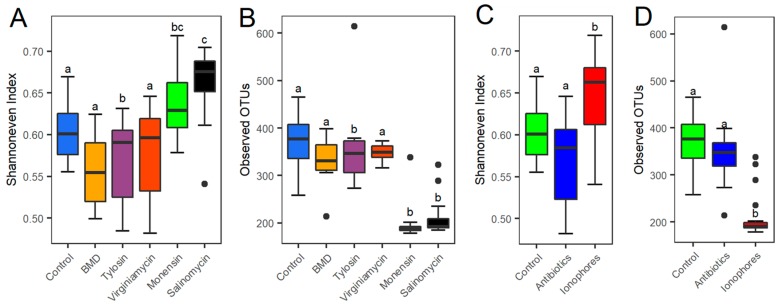
Figure 1.
The α-diversity of cecal microbiota of broilers following 2-week supplementation of different antimicrobials. Changes in evenness and richness were calculated from 12 samples of each treatment using the Shannon evenness index (A) and observed operational taxonomic units (OTUs) (B), respectively. Data from three antibiotics and two ionophore groups were further combined separately and the Shannon evenness index (C) and observed OTUs (D) were recalculated. Results were plotted using box and whisker plots, in which the middle line denoted the median value and the lower and upper hinges represented the first and third quartiles, respectively. Whiskers extended from the hinge to the highest or lowest value no farther than 1.5 × the inter-quartile range. Points outside of this range are considered outliers. One-way ANOVA with post hoc Tukey’s test was performed, with the treatments not sharing a common superscript considered significantly different (p < 0.05).

