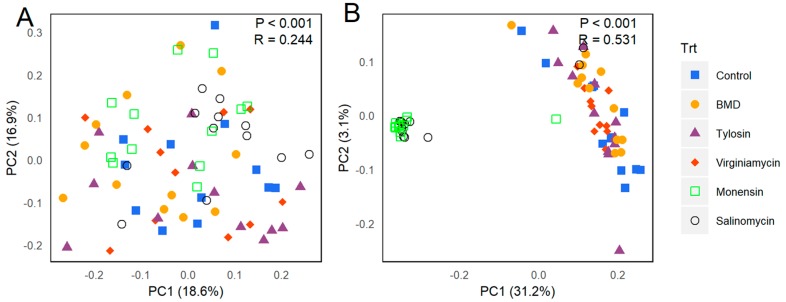
Figure 2.
The β-diversity of cecal microbiota of broilers following 2-week supplementation of different antimicrobials. Principal coordinate analysis (PCoA) plots were generated from 12 samples of each treatment using Bray–Curtis (A) and Jaccard indices (B), respectively. Statistical significance and R values were determined using analysis of similarity (ANOSIM) and indicated in each plot.

