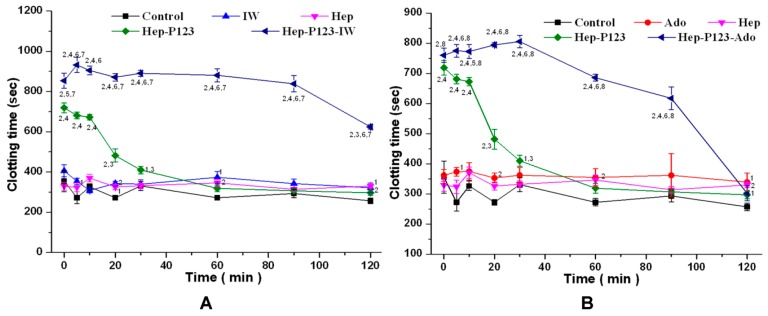
Figure 6.
Whole blood coagulation time. Influence of the IW (A) and Ado (B) as well as their encapsulated forms on the clotting time in comparison with Hep and Hep-P123. The abscissa indicates the time after injection. M ± m. n = 9 for each group. The numbers near the points indicate the probability values (p). 1 − p < 0.05 and 2 − p < 0.01 compared with control. 3 − p < 0.05 and 4 − p < 0.01 compared with Hep. 5 − p < 0.05 and 6 − p < 0.01 compared with Hep-P123. 7 − p < 0.01 compared with IW. 8 − p < 0.01 compared with Ado.

