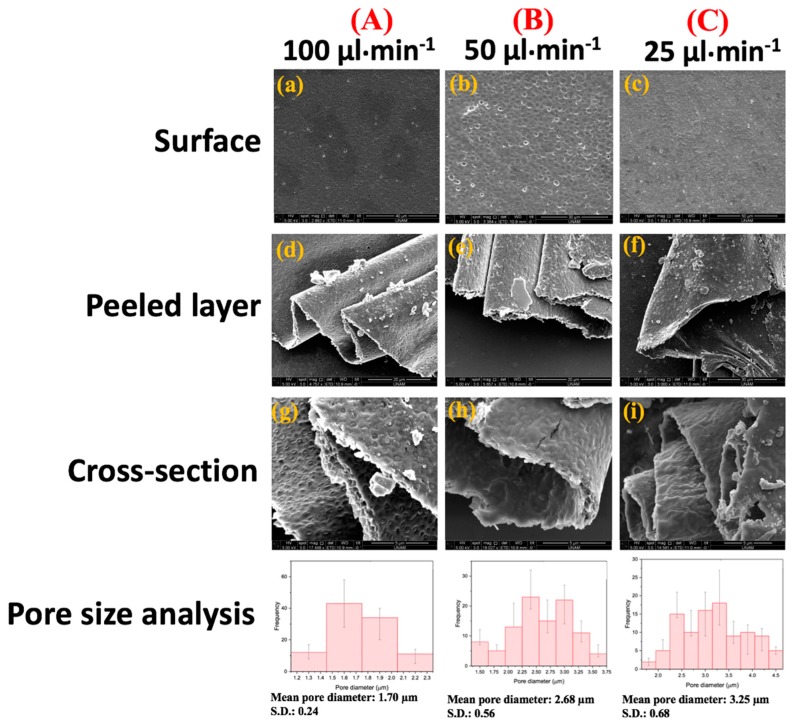
Figure 5.
(a–c) SEM morphologies, (d–f) peeled surface, and (g–i) cross-sectional SEM images of the alginate-based porous films formed at a constant N2 gas pressure of 0.8 bar in a range of various feeding liquid’s flow rates: (A) 100 µL·min−1, (B) 50 µL·min−1, and (C) 25 µL·min−1 (the polymeric solution consisted of 1 wt % alginate and 0.25 wt % PEG-40S in this experimental work). The data in the Pore size analysis graphs are presented as the mean values of standard deviation (SD) of 100 pores.

