
Figure 5.
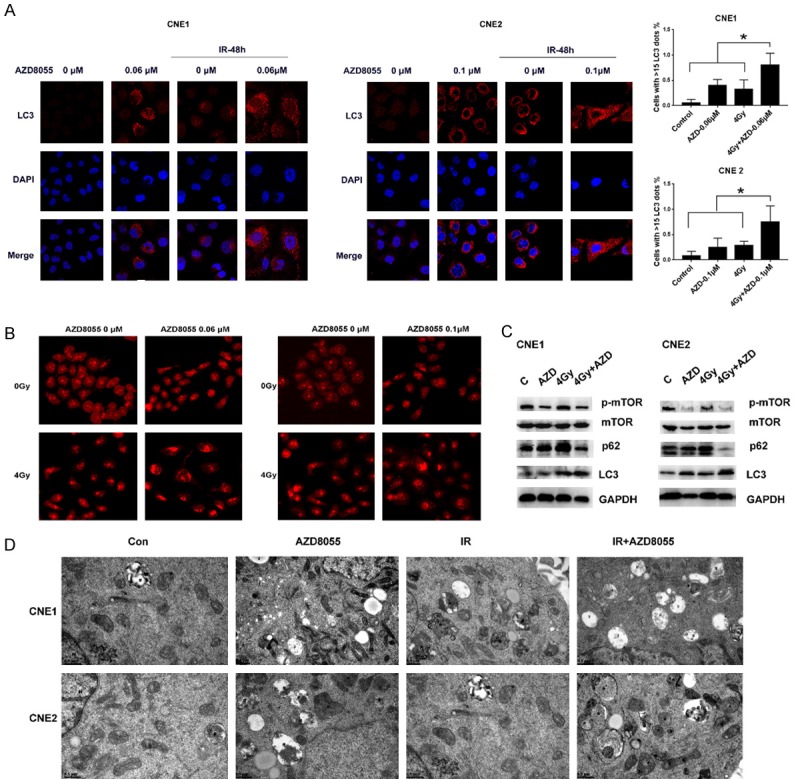
AZD8055 enhanced autophagy. A. Confocal microscopy images of CNE1 and CNE2 cells after immunofluorescence staining for LC3 (red) protein after 2 days of treatment with AZD8055 and 4 Gy IR; the number of cells with more than 15 dots representing LC3 labeling was determined. B. Acridine Orange staining of CNE1 and CNE2 cells treated with AZD8055 and 4 Gy IR. C. Western blot images of p-mTOR, mTOR, p62 and LC3 protein expression assessed in CNE1 and CNE2 cells treated with AZD8055 and 4 Gy IR. D. The ultrastructure of cells with different treatments were analyzed by TEM (23000×). N. Nucleus, *autophaosomes, #amphisomes.