Figure 2.

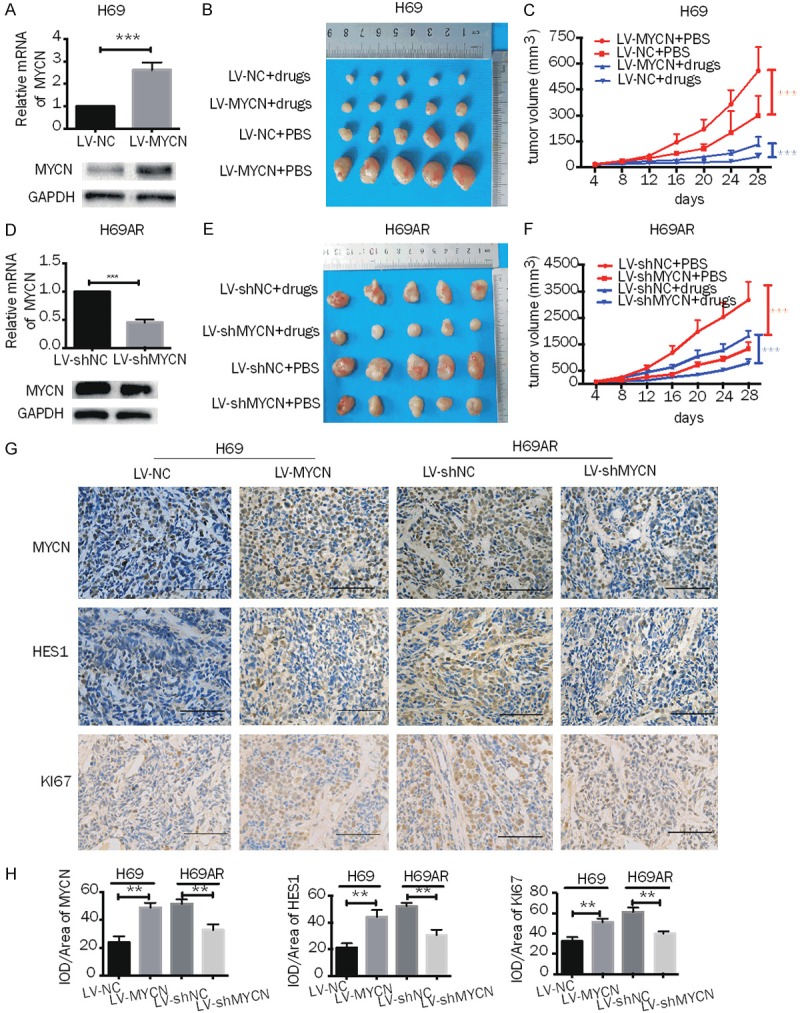
Effects of MYCN on chemoresistance and growth of SCLC in vivo. A, D. RT-qPCR and Western blot analysis of MYCN expression in H69 cells transfected with lentiviral-based MYCN overexpression plasmids and in H69AR cells transfected with lentiviral-based MYCN knockdown plasmids and their corresponding control vectors. B, E. Subcutaneous tumor formation experiments were performed in nude mice injected with H69 cells containing vectors with stably upregulated MYCN or control (LV-MYCN or LV-NC, respectively) or with H69AR cells containing vectors with stably downregulated MYCN or control (LV-shNC or LV-shMYCN, respectively); drugs (CDDP+VP-16) or PBS were intraperitoneally injected (n = 5 mice for each group). C, F, The growth curve of the tumor volumes of mouse groups injected with H69 cells with stable MYCN overexpression or with H69AR cells with stably MYCN knockdown. G, H. Histopathological features and representative IHC staining of MYCN, HES1 and Ki67 in tumor tissues from mice injected with H69 cells with stable overexpression of MYCN or with H69AR cells with stable knockdown of MYCN (magnification 400x). Scale bars, 100 μm. Error bars indicate the mean ± SD from three independent experiments. **, P < 0.01. ***, P < 0.001.
