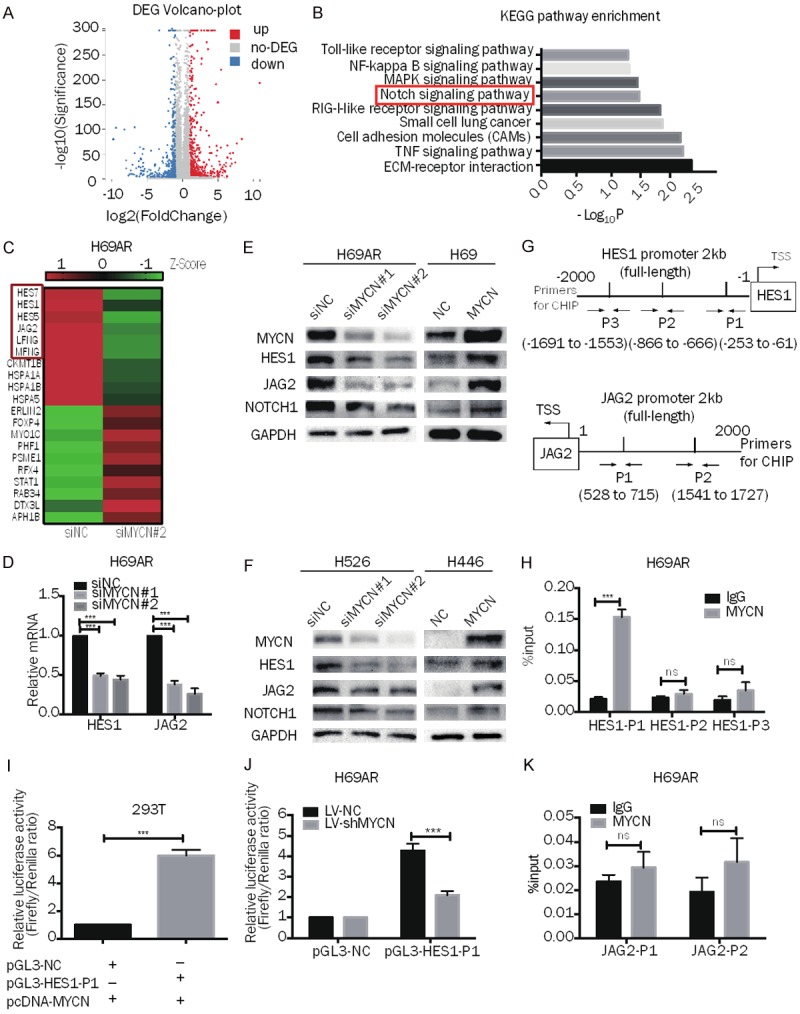
Figure 4.

MYCN regulates the NOTCH pathway and targets HES1 directly in SCLC. A. Volcano plot showing the differentially expressed genes between H69AR-siNC cells and H69AR-siMYCN#2 cells. B. -log10 transformations of the P values of 9 representative and significantly enriched KEGG pathways; the NOTCH pathway is in the red frame. C. Representative heatmap showing 10 downregulated and 10 upregulated genes (6 genes from the NOTCH pathway are shown in the red frame). D. RT-qPCR analysis of HES1 and JAG2 expression in MYCN downregulated H69AR cells and the corresponding control cells. E, F. Western blot analysis of MYCN, HES1, JAG2, and NOTCH1 expression in MYCN-downregulated (H69AR and H526) or MYCN-upregulated (H69 and H446) SCLC cells. G. Prediction of the MYCN binding site and location of the ChIP-qPCR primers in the HES1 promoter region (HES1-P1, HES1-P2, HES1-P3) and the JAG2 promoter region (JAG2-P1, JAG2-P2). H. ChIP-qPCR for MYCN or immunoglobulin G (IgG) at the HES1-P1, HES1-P2 and HES1-P3 regions in H69AR cells. I. Dual-luciferase assay indicating that the activity of the cotransfected HES1-P1 promoter reporter and the pcDNA3.1-MYCN plasmid is stronger than that of the NC promoter reporter and pcDNA3.1-MYCN plasmid group in 293T cells. J. Dual-luciferase assay showing that the activity of the HES1-P1 promoter reporter is weaker in H69AR-LV-shMYCN cells than in LV-shNC cells. K. ChIP-qPCR for MYCN or immunoglobulin G (IgG) at the JAG2-P1 and JAG2-P2 regions in H69AR cells. Error bars indicate the mean ± SD from three independent experiments; ***P < 0.05.
