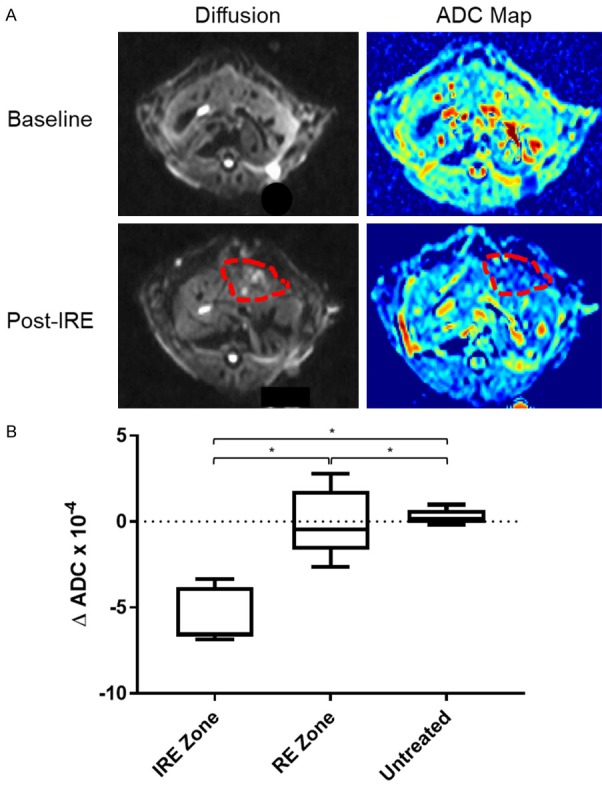
Figure 2.

Diffusion weighted images and analysis. A. Representative DWI and ADC maps before and after IRE treatment. Red-dashed lines enclose margins of IRE treatment. B. Changes in ADC before and after IRE treatment for untreated tissues, IRE zones, and RE zones. One-way ANOVA showed that untreated tissues, IRE zone, and RE zone had significantly different ΔADCs after IRE (*, P<0.05).
