Figure 3.

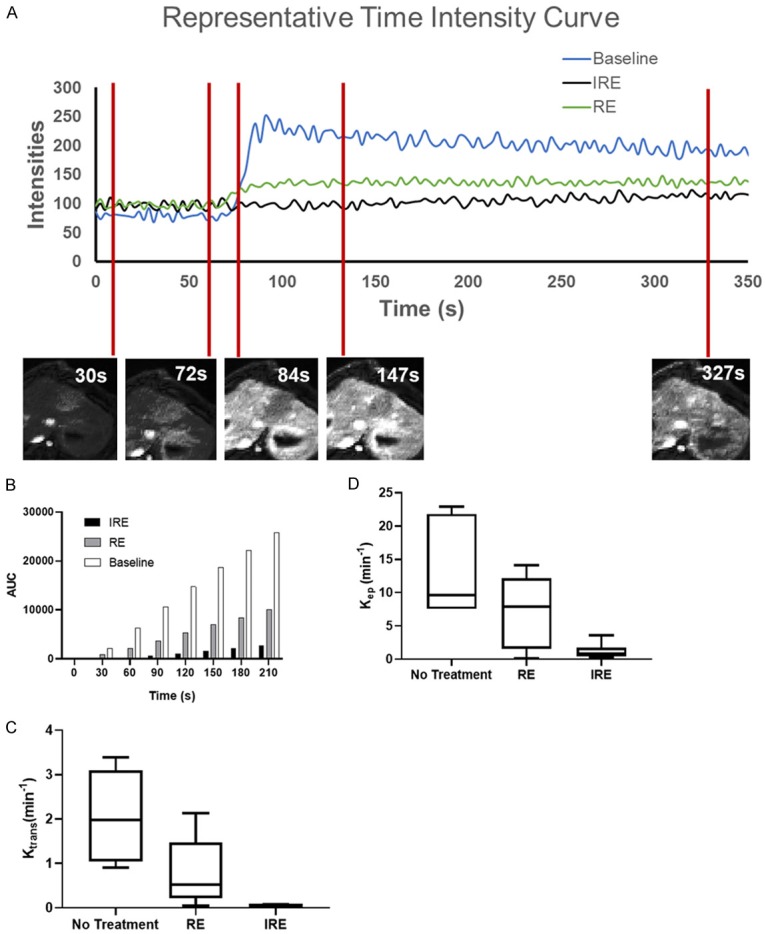
DCE-MRI and analysis. A. Representative TICs of untreated tissues, IRE zone, and RE zone. Representative DCE-MRI images of treated tissues at 30 s, 72 s, 84 s, 147 s, and 327 s are presented below representative TICs. B. Average AUCs of untreated tissue, RE zone, and IRE zone at 30 s, 60 s, 90 s, 120 s, 150 s, 180 s, and 210 s. One-way ANOVA of AUCs in the 3 treated regions showed that AUCs are different across regions for all time points (P<0.05). C. Average Ktrans of all untreated, IRE zone, and RE zone tissue for each rabbit. One-way ANOVA demonstrated that Ktrans is significantly different between different treatment zones (P<0.05). D. Average Kep of all untreated, IRE zone, and RE zone tissue for each rabbit. One-way ANOVA demonstrated that Kep is significantly different between different treatment zones (P<0.05).
