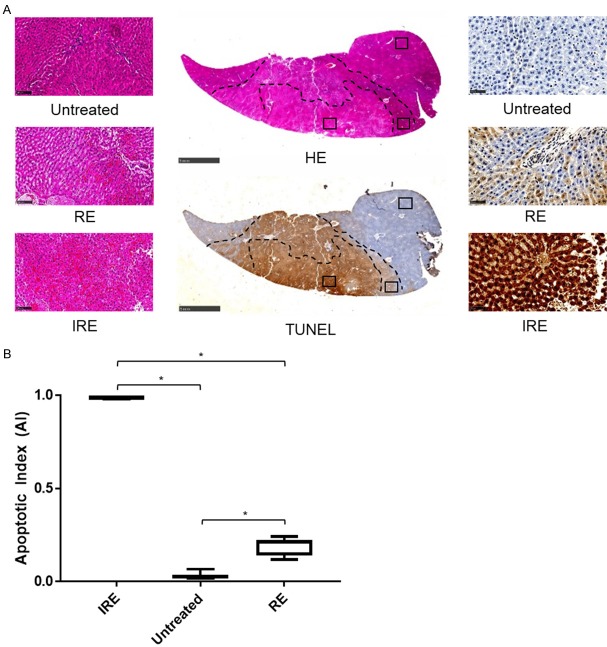
Figure 4.
Histologic analysis of IRE-treated tissues. A. HE-stained and TUNEL-stained representative cross sections of rabbit liver tissue after IRE treatment, with 400× magnification views of each treatment region and for each stain. B. Apoptotic index of each zone in each rabbit averaged across all views in each zone. One-way ANOVA showed that untreated, RE zone, and Ire zone tissues were significantly different (*, P<0.05).

