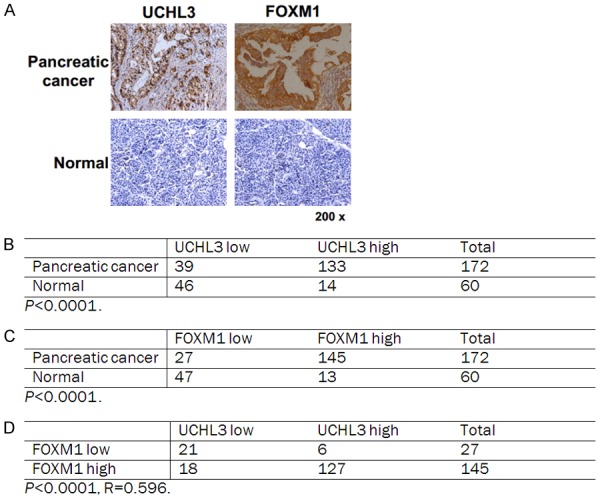
Figure 6.

UCHL3 expression positively correlates with FOXM1 expression in clinical pancreatic cancer samples. A. Representative staining of UCHL3 and FOXM1 in pancreatic cancer and peritumoral pancreatic tissues. B-D. Quantification of UCHL3 and FOXM1 protein levels in normal and pancreatic cancer and the correlation study of UCHL3 and FOXM1 expression level in pancreatic cancer. Statistical analyses were performed with the χ2 test. R: The Pearson correlation coefficient.
