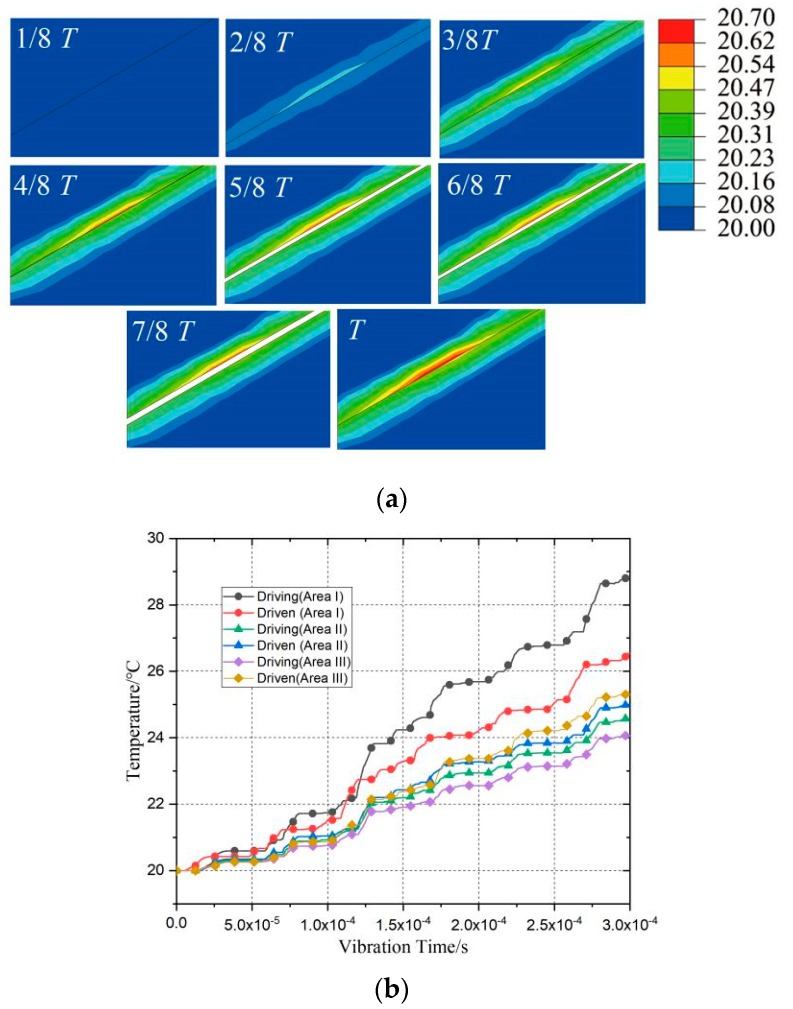
Figure 9.
Temperature variation in friction zone of the first period and maximum temperature change of the first 6 periods. (a) Finite element analysis results for the temperature change: the temperature distribution during the loading period (T/8~T, 6.25 μs time increment), (b) temperature change during the first 6 periods (0~6 T). (area i).

