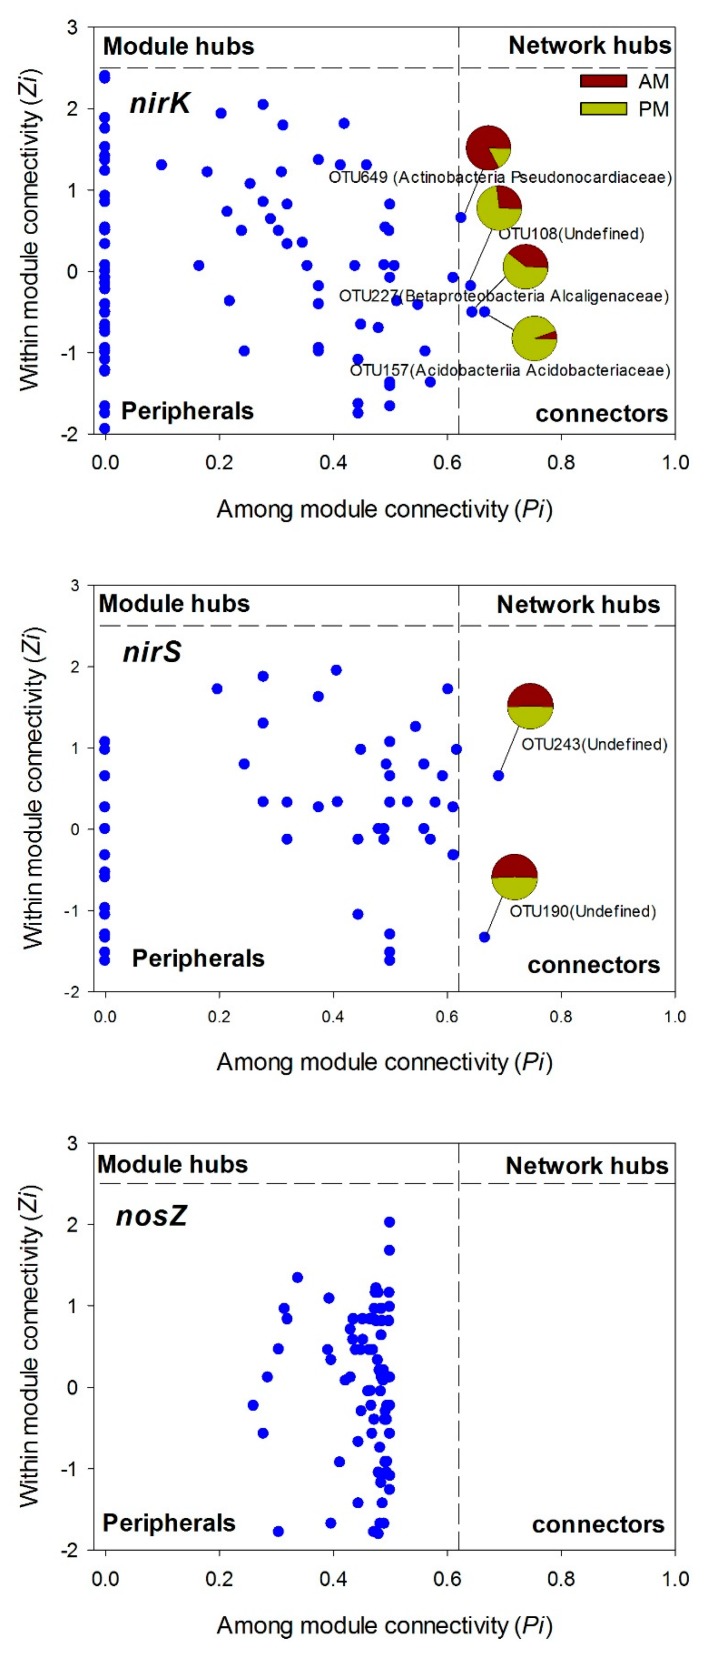
Figure 4.
Zi-Pi plots showing the topological distribution of OTUs in the nirK and nosZ gene containing bacterial networks. The keystone species (module hubs and connectors) are marked by OTU number, and the proportion of the total number of each keystone species detected in the Acacia mangium (AM) and Pinus massoniana (PM) plantations are shown in the pie charts (i.e., the number of OTUs in AM or PM plantations divided the total OTU numbers detected in both types of plantations).

