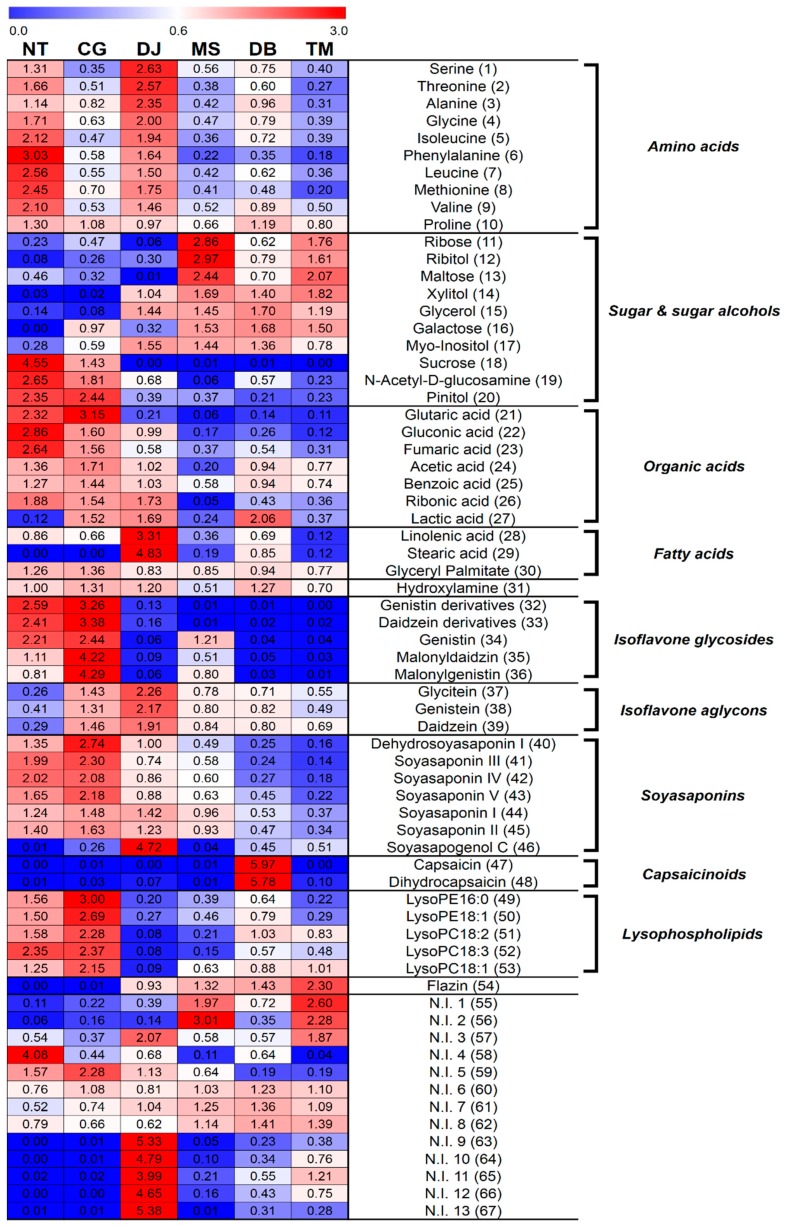
Figure 2.
Heat map representations for the relative contents of significantly discriminant primary and secondary metabolites in six FSPs analyzed by GC-TOF-MS and UHPLC-LTQ-IT-MS/MS. Metabolites were selected by variable importance in the projection (VIP) value > 1.0, p-value < 0.05. All values were averaged for FSP types.

