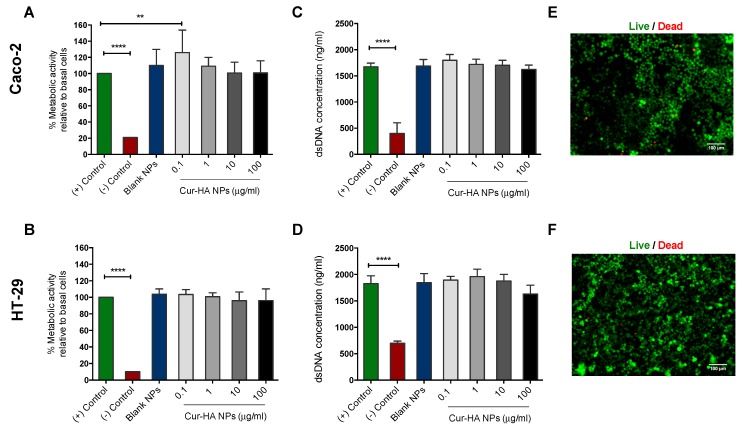
Figure 4.
Cytotoxicity studies of Cur-HA-NPs on colon epithelial like cells (Caco-2, HT-29). Alamar Blue assay of blank, Cur-HA NPs (0.1, 1, 10 and 100 μg/mL), (Media alone-positive control) (DMSO treated- negative control) treatment for cell metabolic activity on Caco-2 and HT-29 cell lines (A,B). Picogreen assay of blank, Cur-HA NPs (0.1, 1, 10 and 100 μg/mL) treatment for cell proliferation on Caco-2 and HT-29 cell lines (C,D). Live/Dead assay images of Caco-2, HT-29 cells after 24 h nanoparticle treatments at 10× magnification (E,F). The results are expressed for each treatment as (n = 3); data are expressed as the mean ± SD. P values were determined by one-way ANOVA with Dunnett’s post hoc test to determine differences between treatments and control group; ** p < 0.01 for control vs. 0.1 ug/mL Cur-HA NPs in the Caco-2 cells, **** p < 0.0001 for (+) control vs. (−) control respectively. No significant differences were noted in the HT-29 cells.

