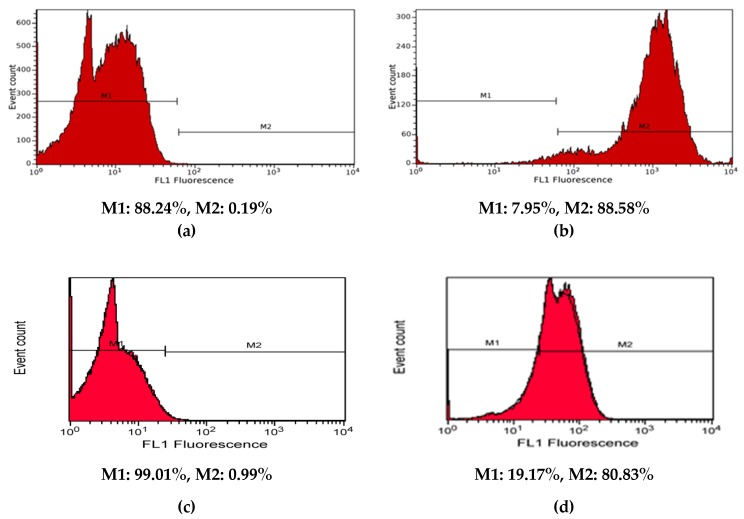
Figure 8.
Histograms of control cells (a and c), of the cells treated with liposomes loaded with fluorescein (b) and of the cells treated with aptamer-functionalized liposomes loaded with fluorescein (d) in order to evaluate their uptake by human dermal fibroblast (HDF) cells. M1—negative for fluorescein, no uptake; M2—positive for fluorescein, cells are loaded with liposomes or aptamer-functionalized liposomes labeled with fluorescein.

