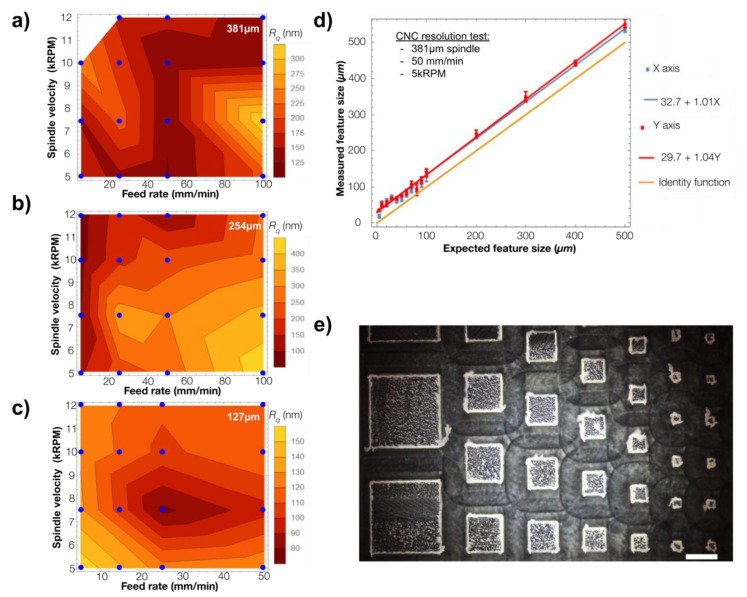
Figure 5.
(a–c) CNC micromilling roughness tests using 3 different end-mill diameters, 381 µm, 254 µm, 127 µm, respectively; the Rq roughness is plotted as a function of both the feed rate and the spindle velocity, the blue points represent our experimental data. (d) Comparison between the designed dimension of the features in the resolution test sample and its measurement, the blue line shows the linear fit made to X-Axis data and in red the linear fit of the Y-Axis data, for comparison in yellow the identity function is plotted, each measurement was repeated 6 times, scale bars represent the standard deviation. (e) Sample of the out-of-plane square pillars used for the resolutions test. Scale bar is 500 µm.

