Figure 2.
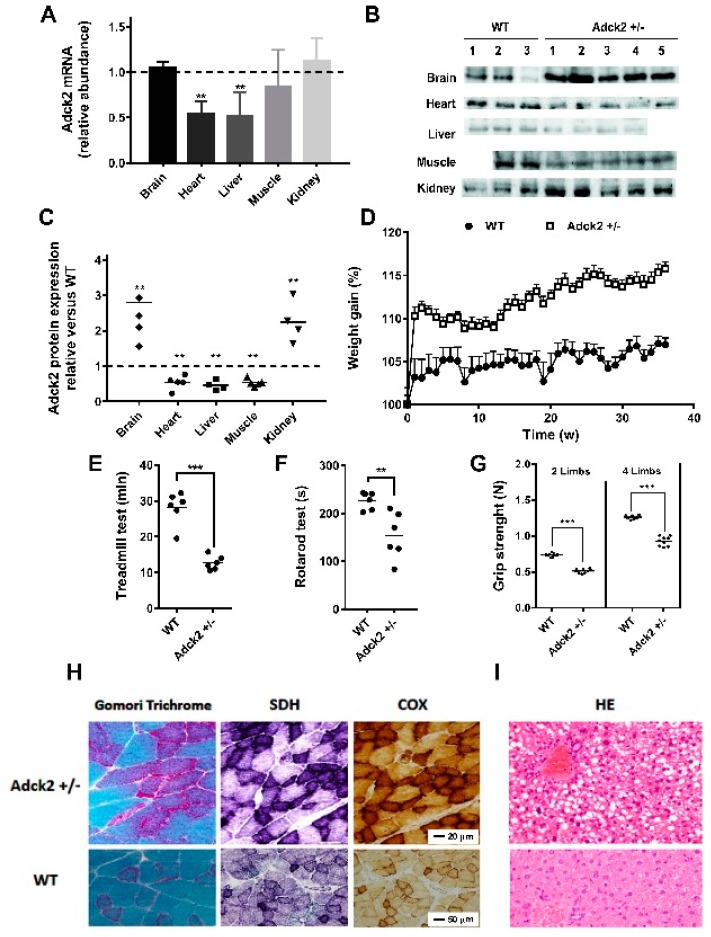
Characteristics of the Adck2+/− mouse model. (A) Relative abundance of Adck2 mRNA levels in different tissues of Adck2+/− mice after normalization to WT controls, depicted as a dotted line. Bars represent mean + SD; ** p < 0.01 (n = 5 per group). (B) Western blot of ADCK2 protein in different mouse tissues. (C) Densitometry of ADCK2 protein levels from panel (B) (n = 4–5). (D) Weight gain trajectories of WT and Adck2+/− male mice on standard diet (n = 15). (E) Physical activity as determined by the running time on a treadmill until exhaustion. (F) The latency period before falling off an accelerating rotarod. (G) Grip strength capacity. ** p < 0.01 vs. WT; *** p < 0.005 vs. WT; n = 6. Data were analyzed by one-way ANOVA (D) and Student’s t test (panels A, B and E–G). (H) Skeletal muscle of Adck2+/− mice stained with Gomori trichrome, succinate dehydrogenase (SDH), and cytochrome c oxidase (COX) were compared to WT; 60× magnification. (I) Light microscopy of mouse Adck2+/− liver showing extensive steatosis compared to WT liver after hematoxylin and eosin (HE) staining; 40× magnification.

