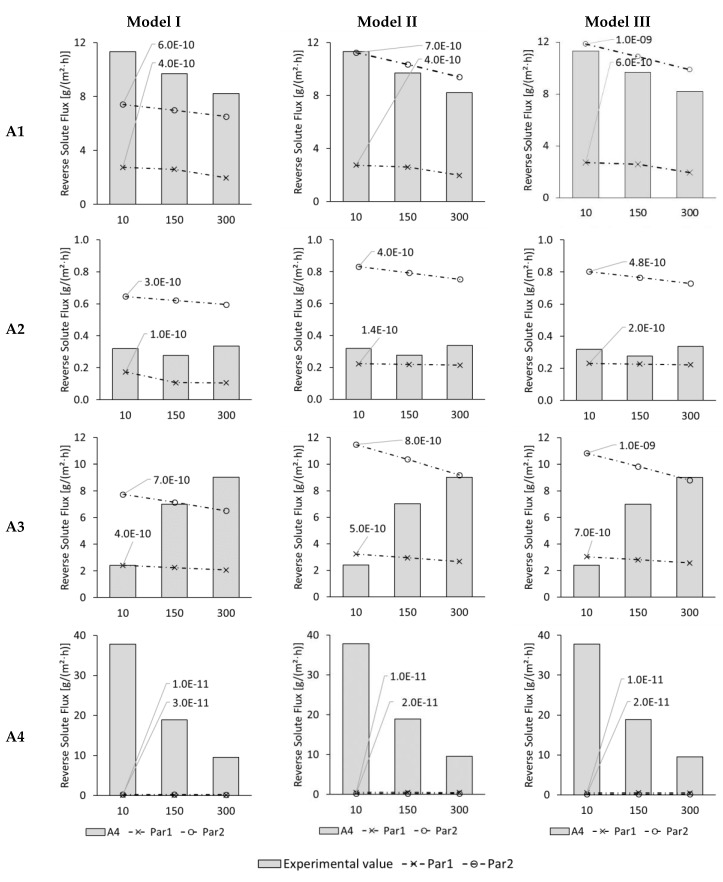
Figure 5.
ALFS reverse solute fluxes of test series A1, A2, A3, and A4 for 10, 150, and 300 min test time from experiments (columns) and Model I, Model II, and Model III with membrane parameter set Par1 (dashed line with crosses) and Par2 (dashed line with circles). Modelled results are shown for best-fitting diffusion coefficient which is indicated next to the corresponding line.

