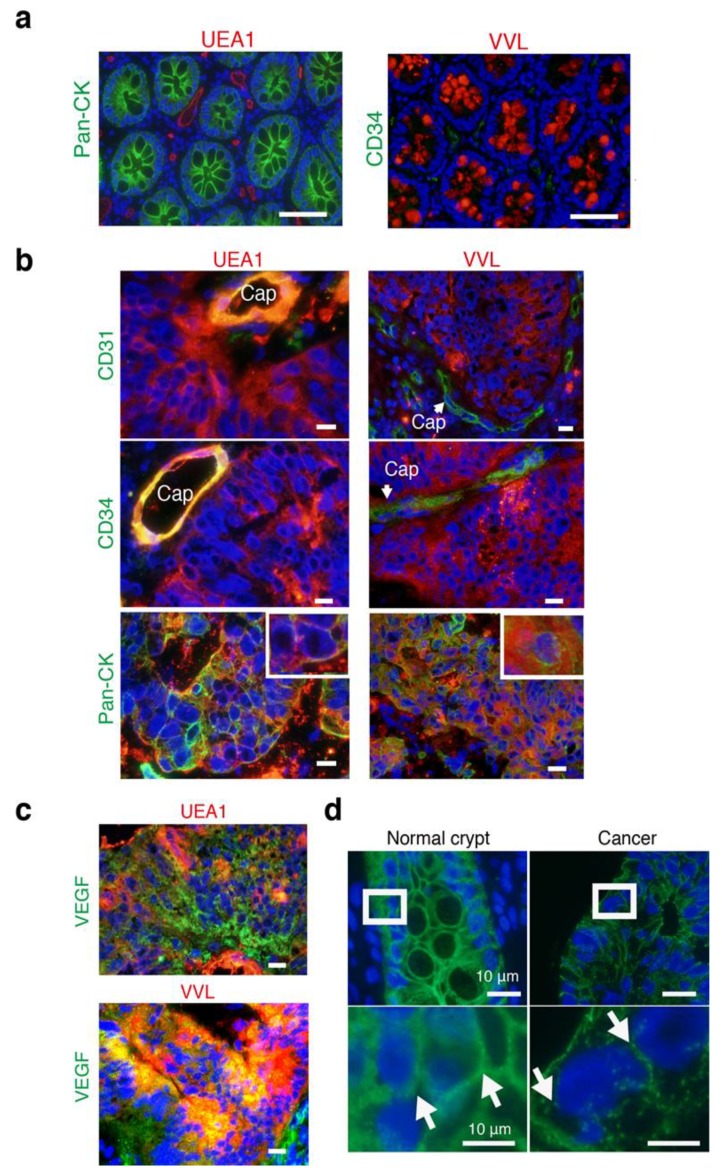
Figure 5.
Cancer- and endothelial-related lectins expressed in cancer intercellular regions. (a) Merged images illustrating IF staining of lectins (UEA-1 and VVL: Red) and antibodies (pan-CK or CD34: green) with DAPI (blue). Scale bars: 10 μm. (b) Merged images illustrating IF staining of lectins (UEA-1 and VVL: red) and antibodies (CD31, CD34, and pan-CK: green) with DAPI (blue). Insets in the Pan-CK panel indicate high magnification. Cap: capillaries. Scale bars: 10 μm. (c) Merged images illustrating IF staining of lectins (UEA-1 and VVL: red) and antibodies (VEGF: green) with DAPI (blue). Scale bars: 10 μm. (d) Merged images illustrating immunofluorescent (IF) staining of CDH1 antibody (green) with DAPI (blue). Insets in upper images indicate lower high magnification images. Scale bars: 10 μm.

