Figure 6.
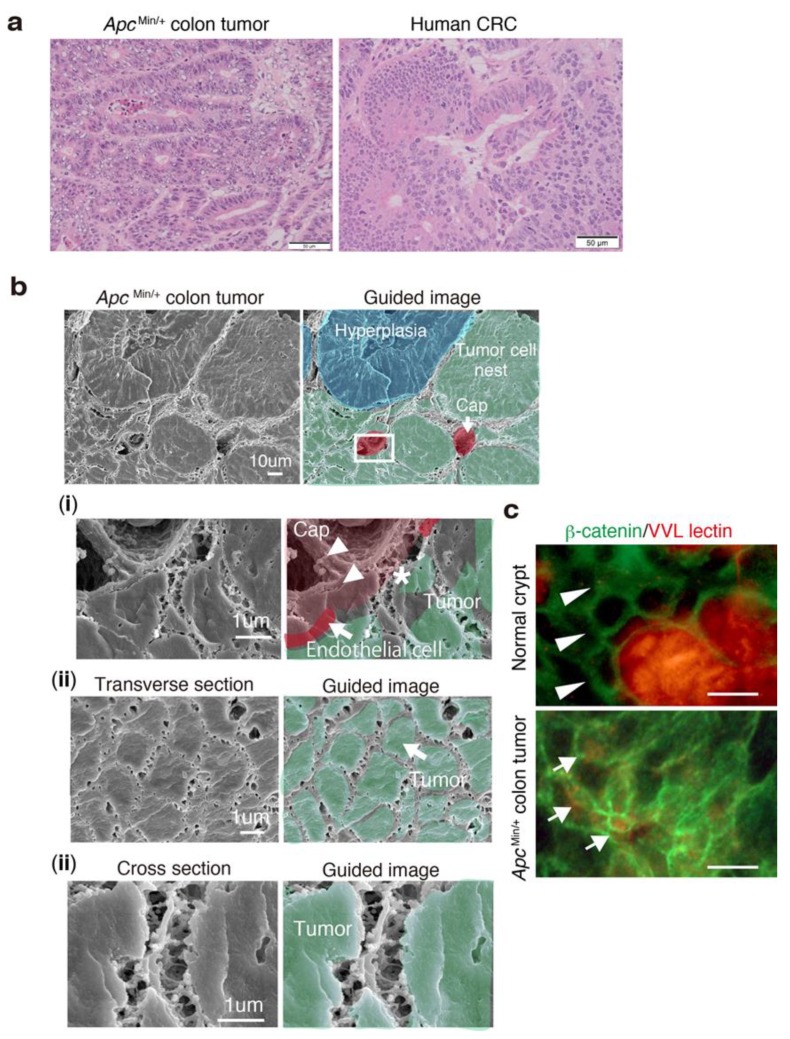
Murine colon cancer phenocopies the 3D network structure in human CRC tissues. (a) Representative hematoxylin and eosin (HE) images of frozen sections of ApcMin/+ colon tumor (left) and human colorectal cancer (right). Older ApcMin/+ mice developed several advanced colon tumors at 30 weeks of age, mimicking human adenocarcinomas. (b) Representative SEM and guided images of a colon tumor in an ApcMin/+ mouse at 30 weeks of age. (i) High magnification of the rectangle in the upper image showing the relationship between a tumor cell nest and a capillary. (ii) Transverse and (iii) cross sections of ApcMin/+ colon tumors. (c) Double IF staining of β-catenin (green) and VVL lectin (red) in the normal crypts and colon tumors of older ApcMin/+ mice. Scale bars indicate 5 μm.

