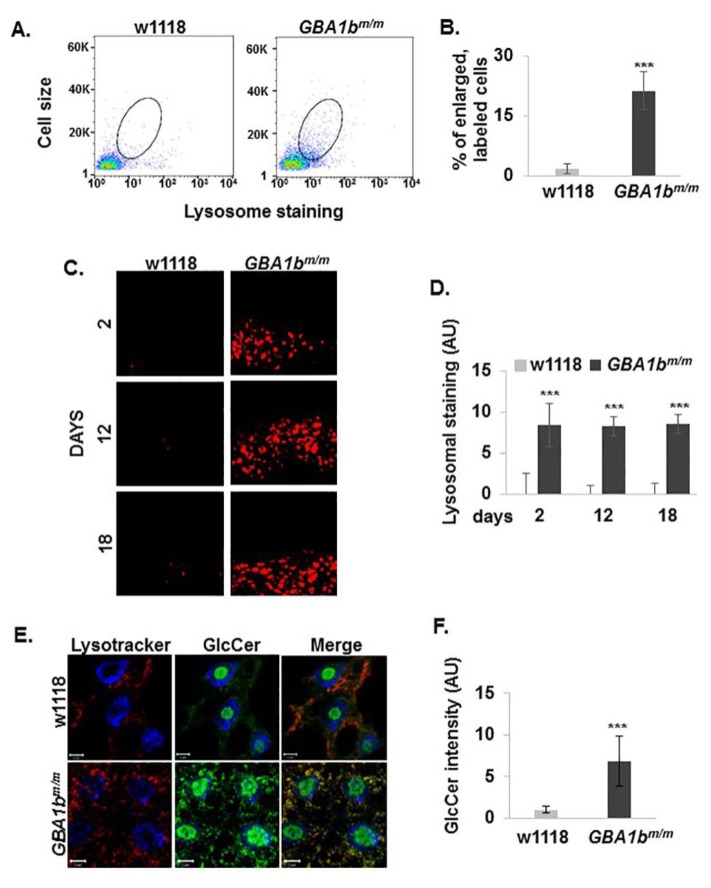
Figure 4.
Changes in lysosomes morphology in GBA1bm/m flies. (A) Hemocytes were extracted from hemolymph of 12-day-old control (w1118) and GBA1bm/m flies, stained with LysoTracker-Red and analyzed by FACS. LysoTracker signal was measured by side scatter using 530 nm excitation (SSC:FITC_530) and cell size was measured by forward light scatter (FSC:LinH). LysoTracker-labeled hemocytes, larger than those extracted from w1118 flies, were encircled. (B). Quantification of encircled cells from (A). Presented is the average ± standard error of three independent assays. (C) Representative confocal images of the subesophageal ganglion of brains dissected from control (w1118) and GBA1bm/m flies at three different time points. (D) Quantification of LysoTracker in images as shown in (C). Presented is the average ± standard error of 30 images from each line. (E) Representative confocal images of Fat body dissected from third instar larvae of control (w1118) and GBA1bm/m flies, stained with Lysotracker and anti GlcCer antibodies. (F) Quantification of GlcCer signal as analyzed form confocal images as shown in (E). Presented is the average ± standard error of 30 images from each line. *** p < 0.0005.

