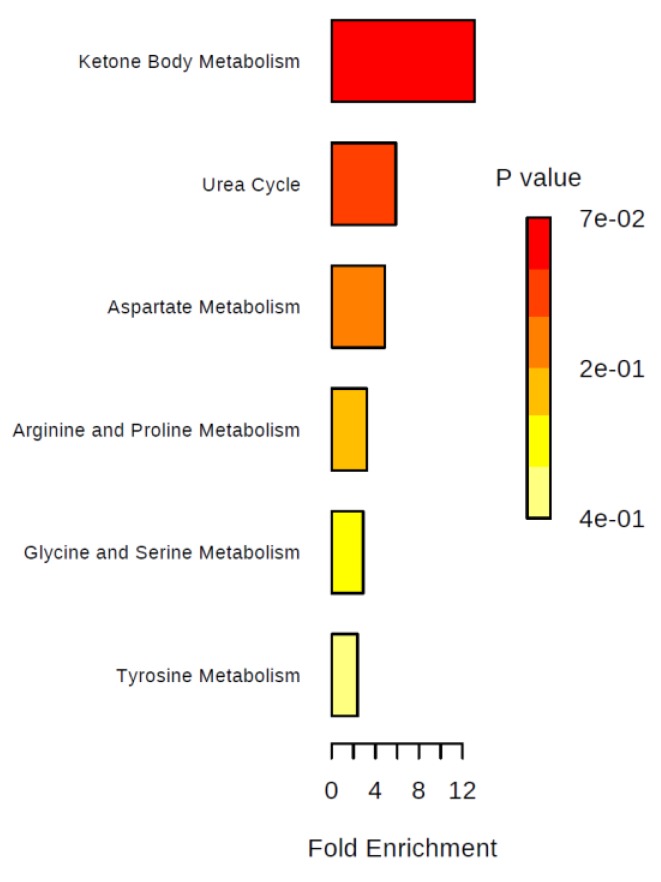
Figure 6.
Summary plot for over-representation analyses (ORA): Urinary metabolites that were different between cachectic and non-cachectic patients. For each of the listed pathways, the respective metabolites identified are listed below: Ketone body metabolism: Acetone (1/13); urea cycle: Arginine (1/29); aspartate metabolism: L-arginine (1/35); arginine and proline metabolism: L-arginine (1/35); glycine and serine metabolism: L-arginine (1/59); tyrosine metabolism: p-Hydroxyphenylacetic acid (1/72).

