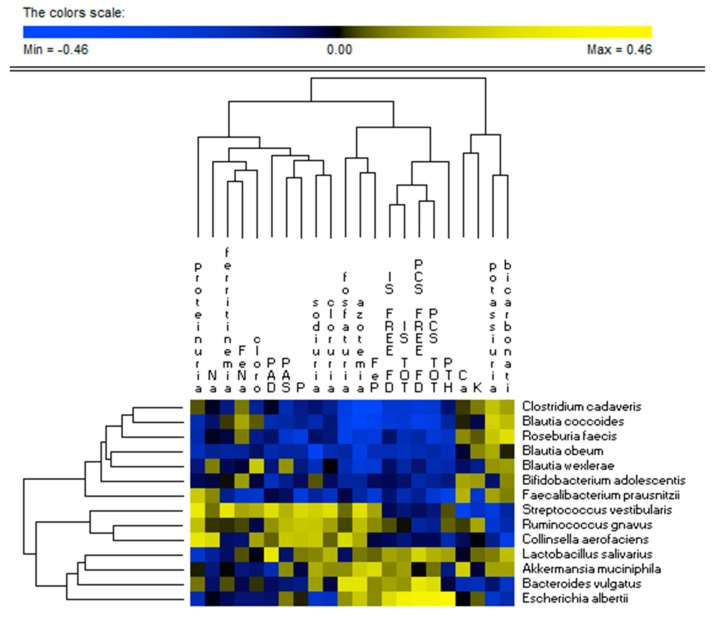
Figure 8.
Correlations between bacterial species and serum metabolome of CKD patients. The colors of the scale bar denote the nature of the correlation, with 1 indicating a perfectly positive correlation (yellow) and −1 indicating a perfectly negative correlation (blue) between species and dietary intake. Only significant correlations (FDR, 0.05) are shown.

