Figure 3.
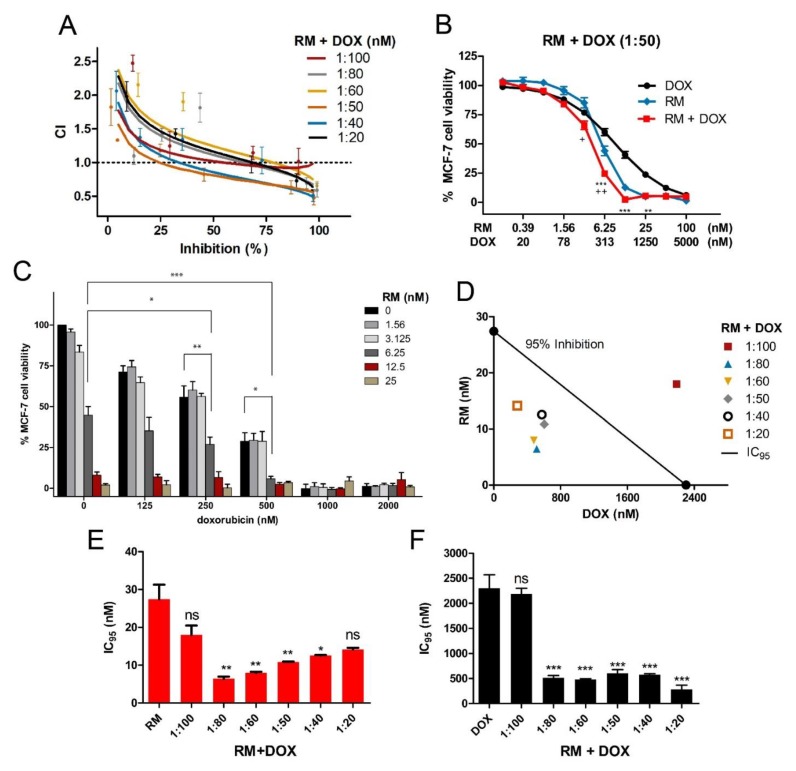
Synergistic cytotoxicity of RM + DOX at multiple combination ratios. MCF-7 cells were treated singly or concurrently with RM plus DOX at different constant molar ratios for 72 h, and the cell viability was assessed using an MTT cytotoxicity assay. (A) The combination index (CI) plot of different combination ratios. Values that fall below and above the line (CI = 1) would mean synergism and antagonism, respectively. Points are experimental data reported in mean ± SEM of three independent trials. (B) Example of curve-shift analysis conducted for the most synergistic combination ratio (1:50). Data points are mean ± SEM of three independent trials performed in quadruplicates * p < 0.05, ** p < 0.001, *** p < 0.0001, and + p < 0.05, ++ p < 0.001 vs. DOX alone and RM alone, respectively (one-way ANOVA/Bonferroni). (C) Comparison of cell viabilities in the checkerboard assay. Bars are mean + SEM of three independent trials. Significant enhancements in cytotoxicity were observed particularly when near IC50 of both drugs (RM 6.25 nM + 250 nM DOX (1:40) and 6.25 nM RM + 500 nM DOX (1:80)) were combined. * p < 0.05, ** p < 0.001, and *** p < 0.0001 (one-way ANOVA/Dunnett’s multiple comparison test). (D) Isobologram analysis of different combination ratios at IC95. The diagonal line denotes additivity at 95% inhibition. The isoboles are the mean of at least three independent trials. (E-F) Comparison of IC95 of single and combination drug treatments. The IC95 were computed using the CompuSyn software. The IC95 of the individual drugs from all sets of combination experiments were averaged and compared to the resulting IC95 after combination treatments. Each set of combination experiments was done at least three times. Data points reported are mean + SEM (n ≥ 3). RM (E) and DOX (F) IC95 were significantly lowered after using in combination at 1:80 to 1:20 ratio. * p < 0.05, ** p < 0.001, *** p < 0.0001, and ns—not significant (one-way ANOVA/Dunnett’s multiple comparison test).

