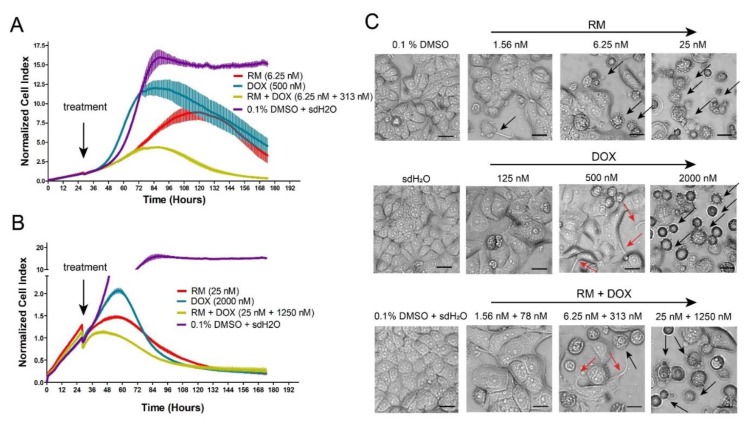
Figure 4.
Dynamic monitoring of the combination effects of RM and DOX on MCF-7 breast cancer cells. Enlarged image of the kinetic cell response profiles of MCF-7 cells treated with combination of (A) 6.25 nM RM + 310 nM DOX or (B) 25 nM RM + 1250 nM DOX for seven days with the single drug equivalents juxtaposed for comparison. The cell indices were normalized at the time of compound addition indicated by the arrow. Data points are mean ± SD of (n = 4) of a representative trial. Full kinetic cell response profiles of MCF-7 cells treated singly and in combination (1:50) of RM and DOX for seven days are shown in Figure S6. (C) Morphological alterations in MCF-7 cells 72-h post treatment with RM + DOX (1:50). Magnification: 20×. Black arrows indicate apoptotic or dead cells. Red arrows indicate spikes peculiar to DOX-treated cells. Scale bar = 20 μm.

