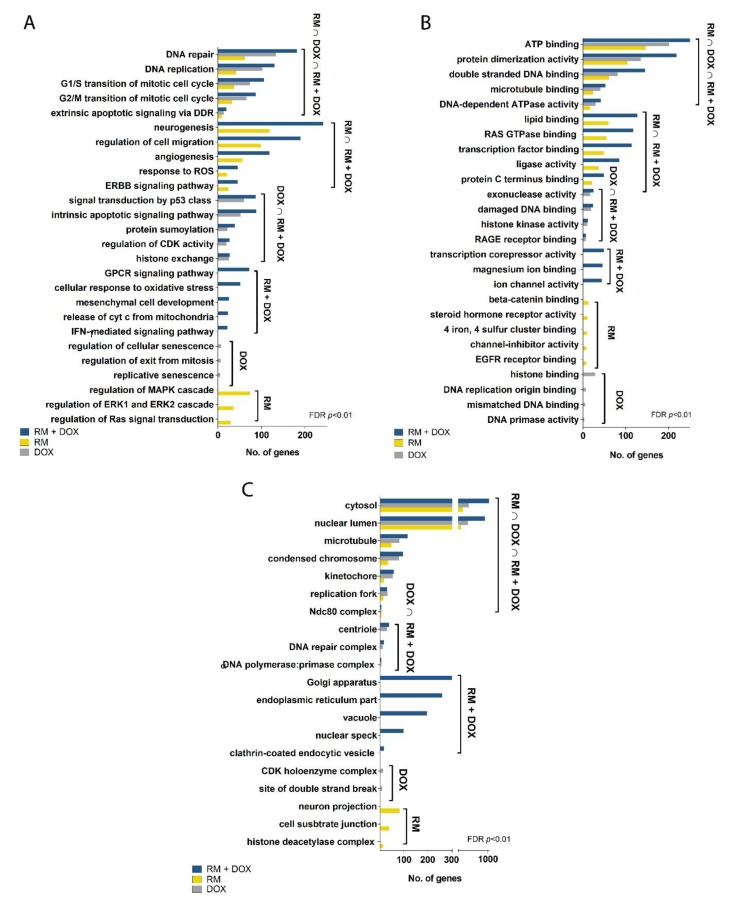
Figure 7.
Gene ontology of the differentially expressed genes in MCF-7 treated with RM and DOX, singly and in combination. Statistical overrepresentation test with Benjamini–Hochberg correction was performed using GO, MSigDB, and QuickGO as reference databases. Only terms with FDR, p < 0.01 were considered significantly enriched. Shown are some of the most significant (A) biological processes, (B) molecular functions, and (C) cellular components as well as the number of genes associated with each term. The unabridged list of significant annotations is shown in Table S2.

