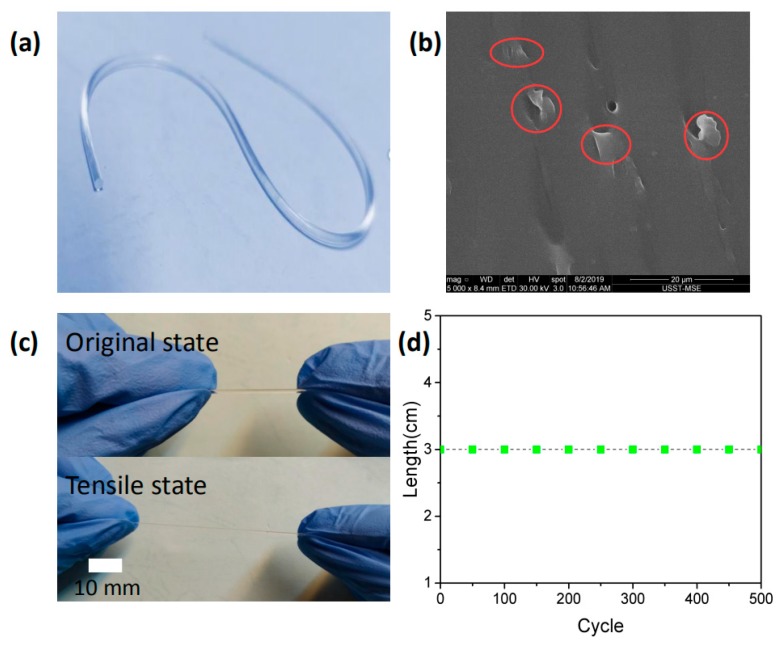
Figure 2.
(a) Digital optical image of graphene-added PDMS fiber. (b) SEM image of PDMS fiber cross-section. The concentration of the tested sample is c = and the red marks are graphene. (c) Digital optical images of the PDMS fiber under the original (top) and stretched (bottom) state, showing the excellent stretchability of the PDMS fiber. (d) The length of the same PDMS fiber was measured and repeated circulation every 100 times after 100% strain.

