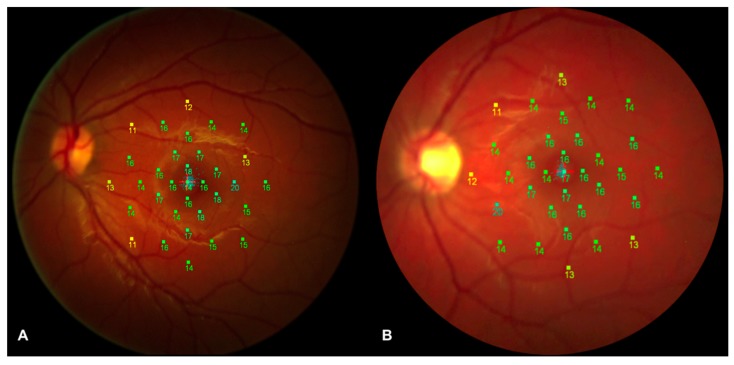
Figure 3.
Microperimetry analysis of a diabetic patient and a healthy control subject. Retinal sensitivity map of a diabetic patient (A) and of a healthy control subject (B) registered along with a color fundus photograph. No significant difference in mean retinal sensitivity was disclosed between the two groups.

