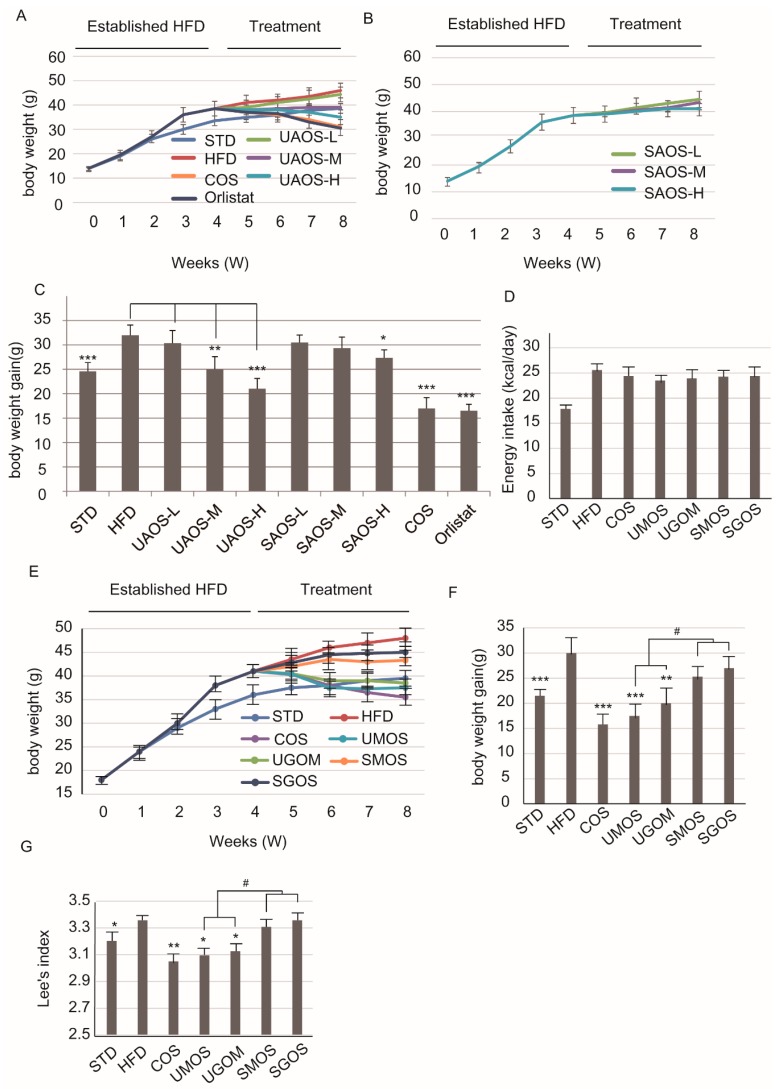
Figure 2.
Changes in body weight on AOS treatment. Changes in body weight of treatment of UAOS (A) and SAOS (B), body weight gain (C) for 4 weeks. The data are represented as means ± standard deviation (SD, n = 6). Changes in the energy intake (D), body weight (E), body weight gain (F), and Lee’s index (G) during the eight-week treatment are shown. The body weight was recorded weekly. The data are represented as means ± standard deviation (SD, n = 12). Compare with HFD group, * p < 0.05, ** p < 0.01, *** p < 0.001. Compare with indicated groups, # p < 0.05.

