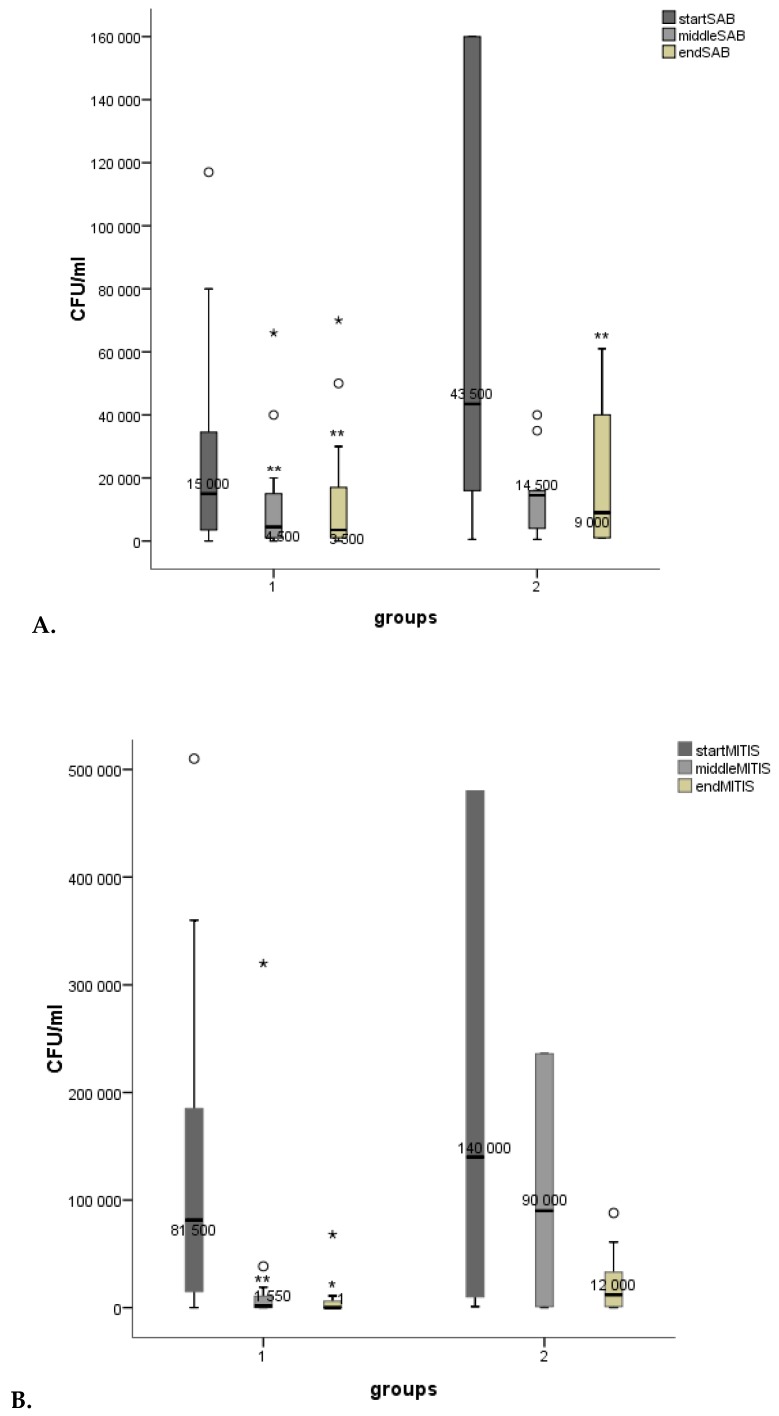
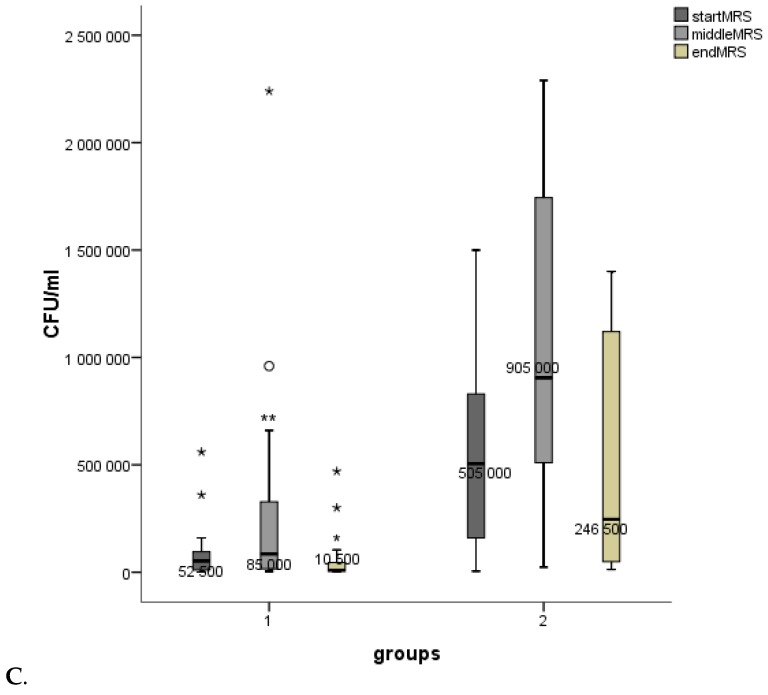
Figure 1.
Boxplots for mean microbial counts (CFU/mL), (A). Candida (SAB), (B). S. mutans (MITIS) and (C). Lactobacilli (MRS). Measuring points for group 1 (start = 0 days, middle = 14 days, end = 28 days) and group 2 (start = 0 days, middle = 7 days, end = 14 days). p < 0.001***, p < 0.01**, p < 0.05* (smaller asterisks). Decreases/increases of microbial counts were compared pairwise: start/middle, start/end. Values more than three interquartile range (IQR) from the end of a box are labeled as extreme outliers (larger asterisks) and values more than 1.5 but less than 3 IQR’s from the end of a box are labeled (o) outliers.


