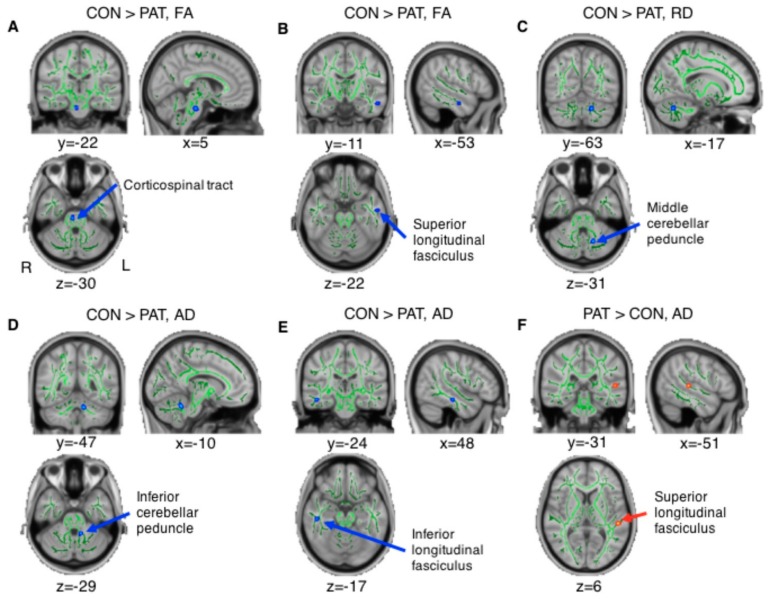
Figure 1.
Significantly different diffusion-based anisotropy findings observed in TBI patients compared with controls (uncorrected p < 0.001 with a cluster of an extent threshold of k > 10 voxels). The figure was visualized on a standard MNI152_T1 brain template with white matter skeleton (green). The locations visualized as red and blue indicate the following regions: (A) right corticospinal tract, (B) left superior longitudinal fasciculus, (C) left middle cerebellar peduncle, (D) left inferior cerebellar peduncle, (E) right inferior longitudinal fasciculus, and (F) left superior longitudinal fasciculus. TBI patients showing (a,b) decreased FA, (c) decreased RD, (d,e) decreased AD, and (f) increased AD in the brain areas. For visualization, group differences found in the TBSS were “thickened” and “filled out” into the local tracts of mean FA track skeleton by using the tbss_fill script. Abbreviations: CON, controls; PAT, patients; TBI, traumatic brain injury, FA, fractional anisotropy; RD, radial diffusivity; AD, axial diffusivity; TBSS, tract-based spatial statistics.

