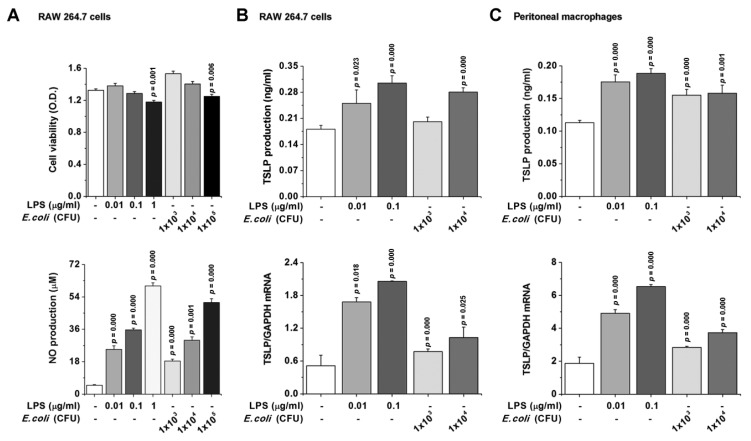
Figure 3.
TSLP is produced in macrophages. (A) RAW 264.7 cells were stimulated with LPS or E. coli for 24 h. (A, upper panel) Cell viability was analyzed by an MTT assay. (A, lower panel) NO concentration was measured by the Griess method. (B,C) Cells were stimulated with LPS or E. coli (upper panel) for 24 h for ELISA or (lower panel) 8 h for real-time PCR. Data are representative of three independent experiments (n = 5/group). A p value indicates the significant difference between PBS and LPS. LPS, lipopolysaccharide; TSLP, thymic stromal lymphopoietin; NO, nitric oxide.

