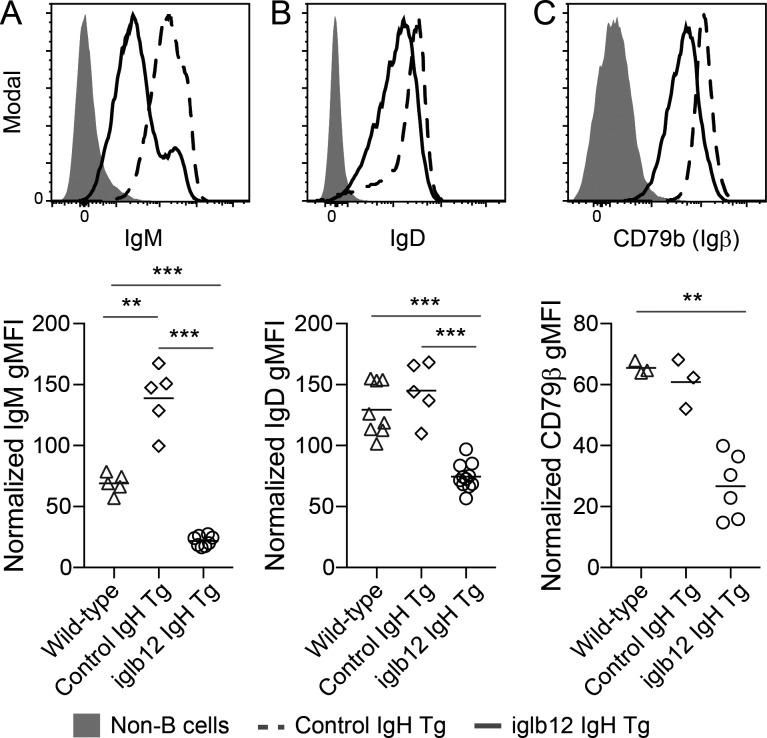
Figure 7.
Reduced BCR expression by mature transgenic B cells expressing the iglb12 heavy chain. (A–C) Representative flow cytometric analysis and quantitation of (A) IgM, (B) IgD, and (C) CD79β expression by mature CD93− B220+ CD19+ CD3− Gr-1− F4/80− B cells in the spleen of iglb12 heavy chain transgenic (Tg), control heavy chain transgenic, and WT mice. Data are pooled from four independent experiments, which were normalized to account for experiment-to-experiment variability by displaying the data as a geometric mean fluorescence intensity (gMFI) fold increase over background fluorescence in CD19− B220− non-B cells. The bar indicates the mean, and P values (**, P < 0.001; ***, P < 0.001) were determined using an unpaired two-tailed Student’s t test (n = 3–11).

