Figure 3.
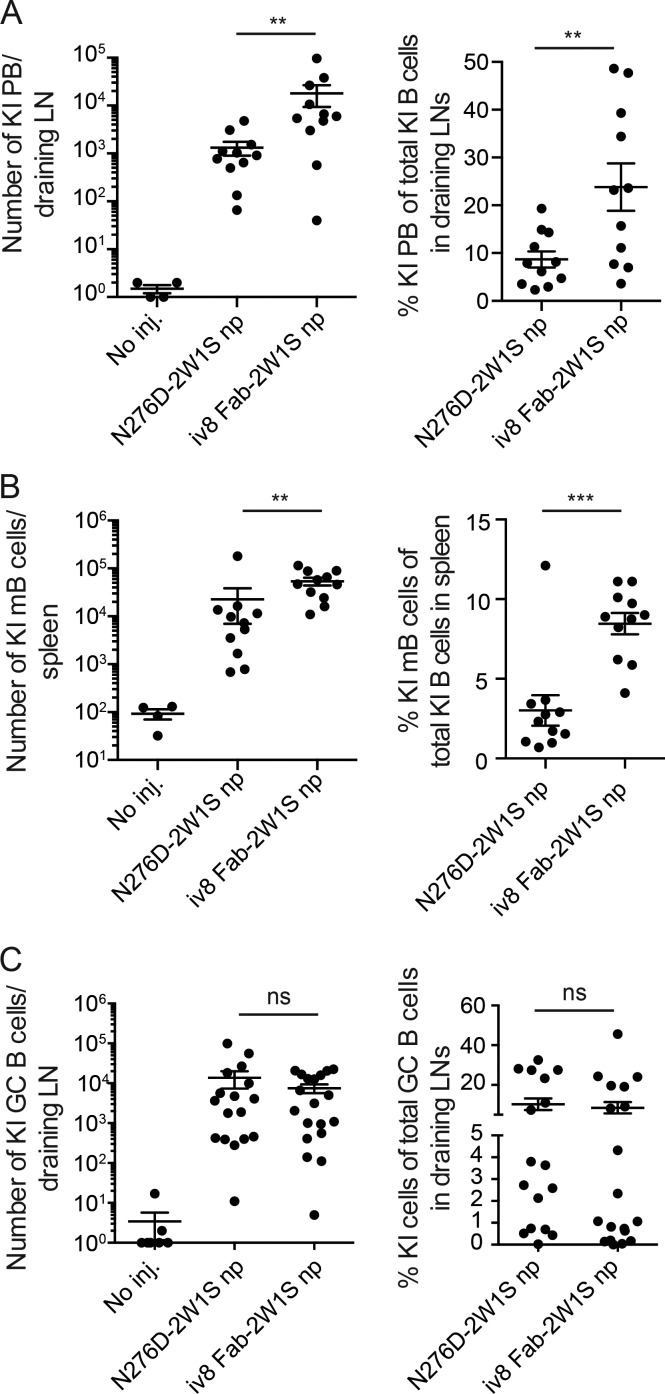
B cell fates in response to iv8 Fab-2W1S or N276D-2W1S nanoparticles. (A) Number of 3BNC60SI knock-in (KI) plasmablasts (PB; CD138+B220lowEnvhigh; left) or frequency of 3BNC60SI plasmablasts of total 3BNC60SI cells (right) per draining LN in 2W1S-primed adoptively transferred wild-type mice 5 d after injection (inj.) with iv8 Fab-2W1S or N276D-2W1S nanoparticles (np) compared with noninjected controls. Lines indicate arithmetic means, and error bars indicate SEM. Each data point represents the average from two draining lymph nodes collected from a single animal (n = 4 uninjected, n = 11 N276D-2W1S np injected, n = 11 iv8 Fab-2W1S np injected). Merged data from two independent experiments are shown. (B) As in A, but measuring number of 3BNC60SI early memory B cells (mB; B220+CTVlowGL7−CD38+; left) or frequency of 3BNC60SI early memory B cells of total 3BNC60SI (right) in spleen at 5 d after injection. Lines indicate arithmetic means, with error bars indicating SEM. Each data point represents the analysis in spleen of one animal (n = 4 uninjected, n = 11 N276D-2W1S np injected, n = 11 iv8 Fab-2W1S np injected). Merged data from two independent experiments. (C) As in A, but measuring 3BNC60SI GC B cells (B220+CD95+CD38−; left) and frequency of 3BNC60SI cells of total GCs (right) 14 d after injection. Lines indicate arithmetic means, and error bars indicate SEM. Merged data from three independent experiments are shown. Each data point represents the average number from two draining lymph nodes collected from a single animal (n = 7 uninjected, n = 17 N276D-2W1S np injected, n = 19 iv8 Fab-2W1S np injected). Statistics in A–C were calculated using the Mann–Whitney U test. **, P ≤ 0.01; ***, P ≤ 0.001; ns, nonsignificant.

