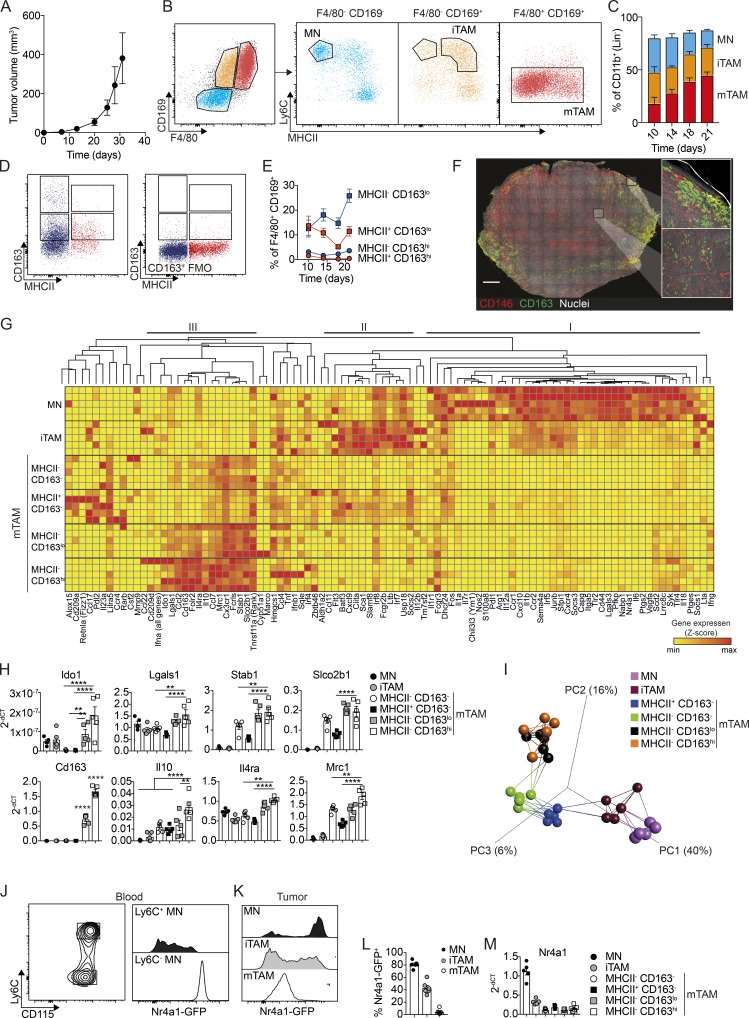
Figure 2.
Characterization of CD163-expressing TAMs in subcutaneous BrafV600E-driven melanomas. (A) Kinetics of tumor development after s.c. injection of 106 YUMM1.7 cells. (B) Flow cytometry analysis of TAMs in YUMM1.7 tumors. Myeloid cells, excluding neutrophils, were gated as CD45+, Lin− (CD5, CD19, NK1.1, Siglec F, Ly6G), CD11b+. MNs were gated as F4/80−, CD169−, Ly6C+, MHCII−; iTAMs as F4/80−, CD169−, Ly6C+, MHCII+; and mTAMs as F4/80+, CD169+, Ly6C−, MHCII+/−. See Fig. S1 C for the full gating strategy. (C) Proportions of MNs, iTAMs, and mTAMs within the myeloid cell compartment at the indicated time points. (D) The distribution of CD163 and MHCII expression among mTAMs; CD163+ TAM (left) were gated based on the fluorescence minus one (FMO) control for CD163 staining (right). (E) Relative proportion of CD163+ TAMs among mTAMs in YUMM1.7 tumors at the indicated time points; data are represented as mean ± SEM of n = 4. (F) Immunofluorescence staining for CD163 (green) and CD146 (indicating blood vessels, red) and nuclei (Hoechst, white) in a 200-µm-thick vibratome cross section of an entire tumor. Image was acquired as a tile-scan with Z-stacks using 10× objective and subsequent processed in 3D (left). High-resolution images was acquired as single Z-stack and processed in 3D (right). Scale bar, 1,000 µm. (G) High-throughput gene expression analysis of MN, iTAM, and mTAM subsets: (1) MHCII− CD163−, (2) MHCII+ CD163−, (3) MHCII− CD163lo, and (4) MHCII− CD163hi (see Fig. S2 D for full gating strategy). Z-scores were calculated by subtracting the ΔCT(sample) from the ΔCT(mean) across all samples. (H) Relative gene expression (2−ΔCT) of Cd163, Il10, Il4ra, Mrc1, Stab1, Slco2b1, Ido1, and Lgals in MN and TAM subsets. (I) PCA and network analysis of gene expression data highlighting the five nearest neighbors. PCA analysis was performed on normalized data (mean = 0 and variance = 1) generating a correlation based PCA plot. Network analysis connects k nearest neighbors (k = 5) based on similarity calculated by Pearson correlation. (J–L) Flow cytometry analysis of blood MNs (J) and tumor-associated MNs, iTAMs, and mTAMs (K) from Nr4a1GFP mice; histograms show GFP expression in MNs, iTAMs, and mTAMs and the proportion of GFP+ cells (L). (M) Relative Nr4a1 gene expression in MN, iTAM, and mTAM subsets. Data are represented as mean ± SEM of n = 5. All statistically significant differences were calculated using Kruskal–Wallis one-way ANOVA followed by Dunn’s multiple comparisons test; **, P < 0.01; ***, P < 0.001; ****, P < 0.0001. All data are representative of a minimum of two independent experiments.

