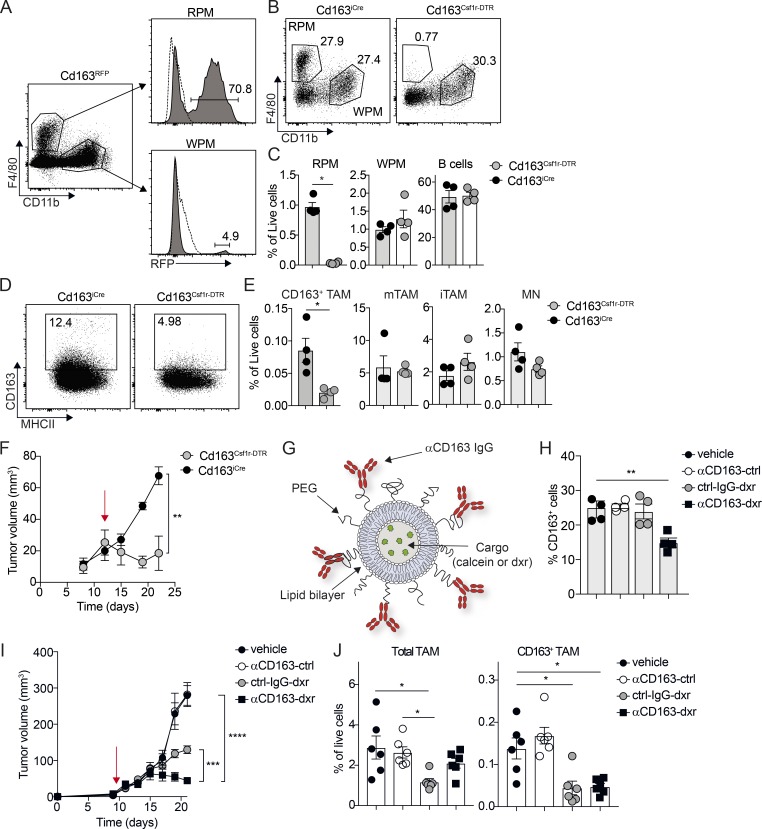
Figure 3.
Specific depletion of CD163-expressing TAMs promotes tumor regression. (A) Flow cytometry analysis of spleen from Cd163iCre/+ × Rosa26lsl-RFP/+ mice (Cd163RFP); RPMs were gated as CD45+, Lin− (CD3, CD19, NK1.1, Ly6G) F4/80+, CD11b− and WPMs as CD45+, Lin− (CD3, CD19, NK1.1, Ly6G) F4/80−, CD11b+. Histograms show relative RFP expression in RPMs and WPMs. (B and C) Flow cytometry analysis of spleen from Cd163iCre/+ × Csf1rlsl-DTR/+ mice (Cd163Csf1r-DTR). RPMs, WPMs, and B cells were analyzed in spleen 24 h after a single injection of 4 ng/kg DT; Cd163iCre/+ littermate control mice injected with DT were used as controls. Representative FACS plots for RPM/WPM analysis (B) and quantification of RPM, WPMs, and B cells in spleen (C) are shown. (D and E) Depletion of CD163+ TAMs in YUMM1.7 melanomas from Cd163Csf1r-DTR mice upon a single injection of 4 ng/kg DT. Representative FACS plots for CD163+ TAMs (D) and quantification of CD163+ TAMs and total TAM, iTAM, and MN in tumors from treated mice (E) are shown. Statistically significant differences were calculated using the Mann–Whitney U test; *, P < 0.05. (F) Tumor growth after sustained depletion of CD163+ TAMs with repeated DT injection; cohorts of Cd163Csf1r-DTR and Cd163iCre/+ mice bearing palpable tumors were treated with 4 ng/kg DT twice a week for 2 wk and tumor volume measured (red arrow indicates initiation of treatment). Statistically significant differences were calculated using a two-way ANOVA followed by Tukey post hoc test; **, P < 0.01. (G) Schematic illustration of αCD163 antibody–conjugated LNPs. PEG, polyethylene glycol. (H) Depletion of CD163-expressing macrophages in spleen after one injection of αCD163-LNP loaded with dxr; mice were injected with dxr-loaded αCD163-LNP (αCD163-dxr), IgG control-LNP (ctrl-IgG-dxr), empty αCD163-LNP (αCD163-ctrl), or PBS alone (vehicle). After 24 h, RPMs were analyzed in spleen by flow cytometry and the proportion of CD163+ RPMs determined. (I) Mice bearing palpable tumors were randomized into groups and treated as in H every second day for 2 wk and tumor volume measured (red arrow indicates initiation of treatment). (J) At endpoint, total TAM and CD163+ TAMs were analyzed by flow cytometry and frequency of live cells calculated. Data in graphs are represented as mean ± SEM of n = 4–6, and results are representative of three independent experiments. Statistically significant differences were calculated using a Kruskal–Wallis one-way ANOVA followed by Dunn’s multiple comparisons test; *, P < 0.05; **, P < 0.01; ***, P < 0.001; **** P < 0.0001.

