Figure 5.
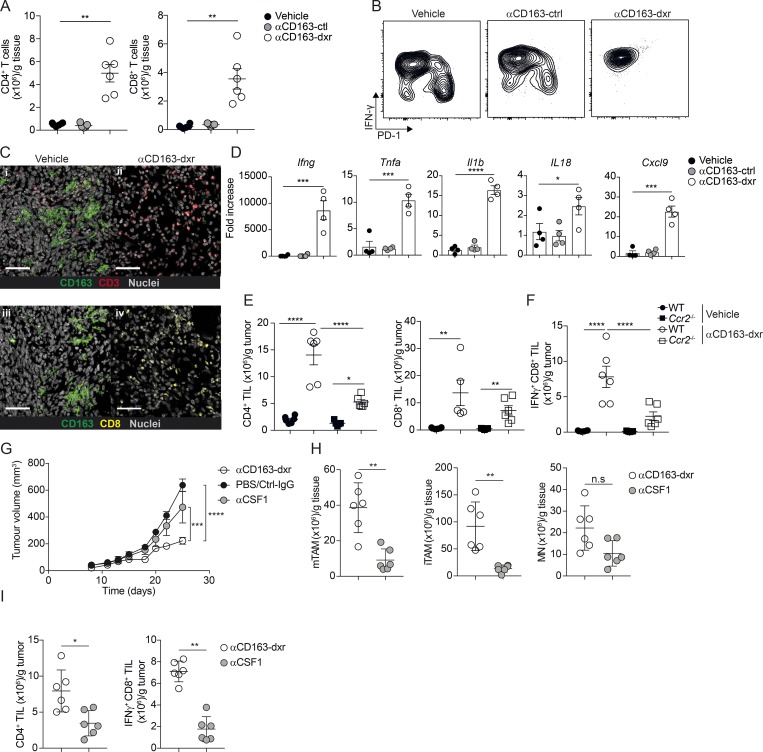
Depletion of CD163+ TAM promotes CD4 and CD8 T cell recruitment. (A) Total numbers of CD8+ and CD4+ T cells in tumor tissue after therapeutic depletion of CD163+ TAMs, analyzed by flow cytometry. T cells were gated as CD45+, Lin− (CD19, NK1.1, Ly6G, CD11b), CD5+, CD3+ and subsequently identified as either CD4+ or CD8+ and numbers per gram of tissue calculated. See Fig. S1 D for the full gating strategy. (B) Flow cytometry analysis of IFNγ and PD-1 expression in tumor-infiltrating CD8+ T cells. Results are representative of three independent experiments with n = 6 per group. (C) Immunofluorescent staining of tumor tissue for CD163 (green), CD3 (red), and CD8 (yellow) in αCD163-dxr– or vehicle-treated mice. Scale bars, 50 µm. (D) Gene expression analysis in tumor tissue from αCD163-dxr– or vehicle-treated mice. Data are represented as mean ± SEM of n = 5. (E and F) Flow cytometry analysis of tumor-infiltrating T cells in WT and Ccr2−/− mice after therapeutic depletion of CD163+ TAMs; total numbers of (E) CD4+ T cells and CD8+ T cells and (F) IFNγ+ CD8+ T cells were calculated and expressed per gram of tissue. Statistically significant differences were calculated using a Kruskal–Wallis one-way ANOVA followed by Dunn’s multiple comparisons test; *, P < 0.05; **, P < 0.01; ***, P < 0.001; ****, P < 0.0001. (G) Treatment study comparing efficacy of CD163+ TAM depletion with pan-macrophages depletion using αCSF1 blocking antibody. Mice bearing palpable tumors were randomized into groups and treated with either αCD163-dxr (n = 6) or PBS (n = 4) i.v. every second day for 2 wk or αCSF1 (n = 6) or controls (CtrlIgG, n = 6 or PBS, n = 6) i.p. every 5 d. Statistically significant differences were calculated using a two-way ANOVA followed by Tukey post hoc test; ***, P < 0.001; ****, P < 0.0001. (H and I) At endpoint, the total number of mTAM, iTAM, and MN (H) or CD4+ TILs and IFNγ+ CD8+ TILs (I) was analyzed by flow cytometry and calculated from frequency of live cells. Data are represented as mean ± SEM of n = 6. Statistically significant differences were calculated using a Mann–Whitney U test; *, P < 0.05; **, P < 0.01; ***, P < 0.001; ****, P < 0.0001. All data are representative of two independent experiments. n.s., not significant.

