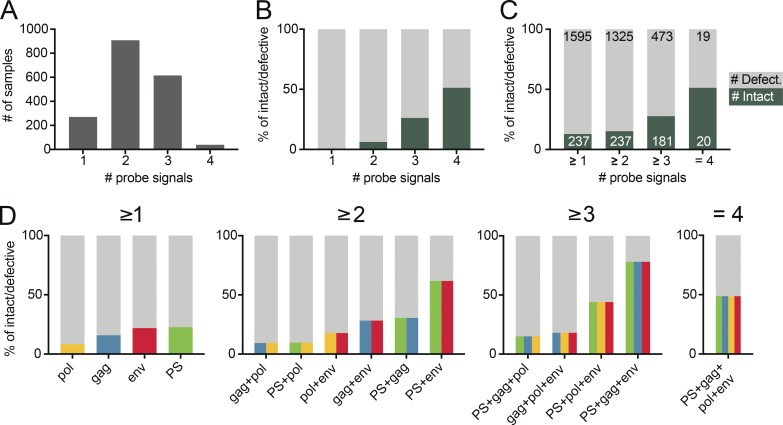
Figure 5.
Probe analysis. (A) Bar graphs showing the total number of sequenced samples that scored positive for any one, two, three, or all four qPCR probes out of a total of 1,832 assayed. (B) Stacked bar graphs showing the predictive value for intact (dark green) and defective (gray) proviral genomes of sequenced samples positive for any one, two, three, or four qPCR probes, respectively. (C) Stacked bar graphs showing the predictive value for intact (dark green) and defective (light gray) proviral genomes of sequenced samples positive for at least one, two, three, or four qPCR probes, respectively. The number of samples is depicted in white (intact) or black (defective), respectively. (D) Graphs showing the predictive value for intact and defective proviruses of individual probes and all possible combinations of at least two, three, or all four probes, respectively. The predictive value for intact proviruses is colored for each individual probe (PS, green; gag, blue; pol, yellow; and env, red) or as color combinations for specific probe combinations. The defective fraction is shown in gray.

