Figure 3.
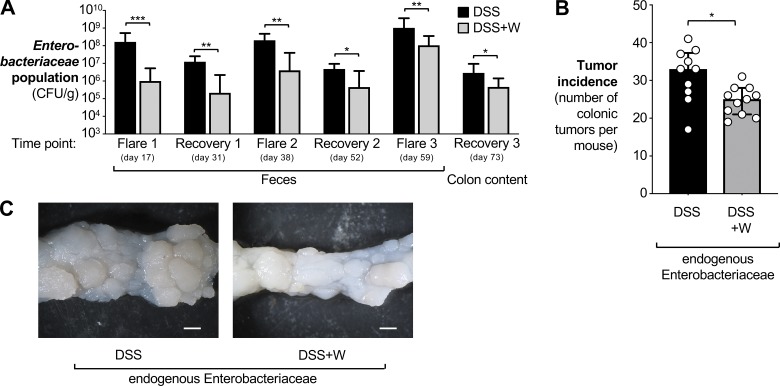
Contribution of the native gut microbiota to tumorigenesis in the AOM/DSS colitis model. Mice harboring endogenous Enterobacteriaceae were treated with AOM and DSS as described in Fig. 1, except that the antibiotic treatment and colonization with E. coli was omitted. Tissue was obtained 73 d after AOM treatment. Groups received either 2% DSS (n = 10, black bars) or 2% DSS + 0.2% sodium tungstate (n = 11, gray bars). Data from one experiment are shown. (A) The burden of Enterobacteriaceae in the feces and in the colon content at the indicated time points was determined by plating on MacConkey agar plates. Bars represent the geometric mean ± 95% confidence interval. P values were calculated by two-way ANOVA and a post hoc Tukey’s multiple comparison test on log-transformed data. (B) Tumor incidence in the colon. Bars represent the median ± interquartile range. P values were calculated by two-tailed Mann–Whitney U test. (C) Representative images of the distal colon. Scale bars represent 1 mm. *, P < 0.05; **, P < 0.01; ***, P < 0.001.

